
Saturday June 7, 2025 - 2:07 pm
The heat is on
| Activity: | Mountain Bike |
|---|---|
| Location: |
Memorial Park
 |
| Device: | Edge 540 Solar |
close
-
Layers w
- Weather Layers
- Pro
- Pro
- Pro
- Pro
- Pro
- Pro
- More Layers
- Pro
- Pro
- Pro
- Pro
-
Upgrade to

3D
Trail Conditions
- Unknown
- Snow Groomed
- Snow Packed
- Snow Covered
- Snow Cover Partial
- Freeze/thaw Cycle
- Icy
- Prevalent Mud
- Wet
- Variable
- Ideal
- Dry
- Very Dry
Trail Flow (Ridden Direction)
Trailforks scans users ridelogs to determine the most popular direction each trail is ridden. A good flowing trail network will have most trails flowing in a single direction according to their intension.
The colour categories are based on what percentage of riders are riding a trail in its intended direction.
The colour categories are based on what percentage of riders are riding a trail in its intended direction.
- > 96%
- > 90%
- > 80%
- > 70%
- > 50%
- < 50%
- bi-directional trail
- no data
Trail Last Ridden
Trailforks scans ridelogs to determine the last time a trail was ridden.
- < 2 days
- < 1 week
- < 2 weeks
- < 1 month
- < 6 months
- > 6 months
Trail Ridden Direction
The intended direction a trail should be ridden.
- Downhill Only
- Downhill Primary
- Both Directions
- Uphill Primary
- Uphill Only
- One Direction
Contribute Details
Colors indicate trail is missing specified detail.
- Description
- Photos
- Description & Photos
- Videos
Trail Popularity ?
Trailforks scans ridelogs to determine which trails are ridden the most in the last 9 months.
Trails are compared with nearby trails in the same city region with a possible 25 colour shades.
Think of this as a heatmap, more rides = more kinetic energy = warmer colors.
- most popular
- popular
- less popular
- not popular
ATV/ORV/OHV Filter
Max Vehicle Width
inches
US Cell Coverage
Legend

Radar Time
Activity Recordings
Trailforks uses anonymized public activity data.
?
Activity Recordings
Trailforks uses anonymized public activity data.
?
Personal Heatmap
▶
Activity Types
all
/
none
▶
Options
2
Date range
month
–
Winter Trails
Warning
A routing network for winter maps does not exist. Selecting trails using the winter trails layer has been disabled.
Missing Trails
Most Popular
Least Popular
Trails are colored based on popularity. The more popular a trail is, the more red. Less popular trails trend towards green.
Jump Magnitude Heatmap
Heatmap of where riders jump on trails. Zoom in to see individual jumps, click circles to view jump details.
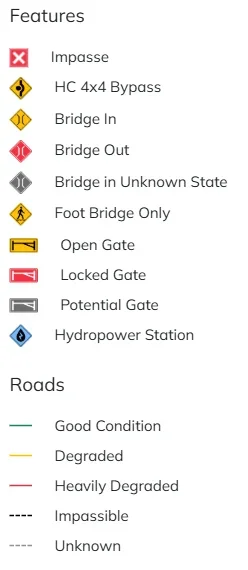
BC Backroad Status
![map legend]()
Service Road Atlas is a free to use, community-driven service for viewing and creating reports on the numerous back-country service roads around B.C. and Alberta.
Slope Aspect
Direction the slope faces
Trails Deemphasized
Trails are shown in grey.
Only show trails with no bike usage.
Suggested Layers
Based on selected activity type
Save the current map location and zoom level as your default home location whenever this page is loaded.
Save
20.5 miles
Distance
01:43:40
Moving Time
930 ft
Climb
| Total Time: | 01:47:32 |
|---|---|
| Singletrack: | 19% |
| Avg Speed: | 11 mph |
| Avg Moving Speed: | 12 mph |
| Max Speed: | 23 mph |
| Pace: | 5:30 /mi |
| Elev Max: | 62 ft |
| Climb: | 930 ft |
|---|---|
| Climb Dist: | 3 miles |
| Descent: | 929 ft |
| Descent Dist: | 3 miles |
| Flat Dist: | 15 miles |
Badges Awarded
Local Weather During Ride
- Summary
Mostly Cloudy - Temperature
29° (27°/35°) - Precip
0 mm/h - Wind
6.24 km/h - Cloud Cover
64% - Humidity
0.8
| trail | dist | speed | time | ||
|---|---|---|---|---|---|
| Roller Coaster East | 1,650 ft | 8 mph | 02:21 | ||
| Roller Coaster West | 1,998 ft | 7 mph | 03:03 | ||
| South Coastal Prairie Trail | 2,789 ft | 17 mph | 01:59 | ||
| Yellow Trail | 3,228 ft | 9 mph | 04:01 | ||
| RC Connector | 522 ft | 15 mph | 00:26 | ||
| Aqua Trail | 3,599 ft | 14 mph | 03:02 | ||
| Orange Trail | 1 mile | 12 mph | 05:56 |
Click trail distance to view matched section on map
| Largest Jump: |
84 score 10 ft distance 0.47 seconds hangtime |
|---|
| Avg Score: | 73 |
|---|---|
| Total Distance: | 57 ft |
| Total Hangtime: | 2.88 sec |
| trail | distance | hangtime | speed | score | |
|---|---|---|---|---|---|
| 1 | 8 ft | 0.39 sec | 14.3 mph | 71 | |
| 2 | 6 ft | 0.38 sec | 9.8 mph | 60 | |
| 3 | 7 ft | 0.41 sec | 11.9 mph | 68 | |
| 4 | 10 ft | 0.47 sec | 14.4 mph | 84 | |
| 5 | 8 ft | 0.39 sec | 14.3 mph | 71 | |
| 6 | 10 ft | 0.37 sec | 17.6 mph | 74 | |
| 7 | 9 ft | 0.47 sec | 12.7 mph | 80 |
Jumps By Trail
| trail | total jumps | max score | ||
|---|---|---|---|---|
| 1 | Aqua Trail | 2 this ride 5 all time | 74 this ride 76 all time | |
| 2 | Roller Coaster West | 1 this ride 4 all time | 84 this ride 84 all time | |
| 3 | Green Ridge Trail | 1 this ride 38 all time | 80 this ride 83 all time |
| type | title | rating | |
|---|---|---|---|
 | Trail Map | ||
 Bridge Bridge | Callout Bridge (Steep Washout) | ||
 | Parking |
- By Royle-MTB

- #92806387
- Device: Edge 540 Solar
- Source: cron-garminpush
- Timezone: America/Matamoros