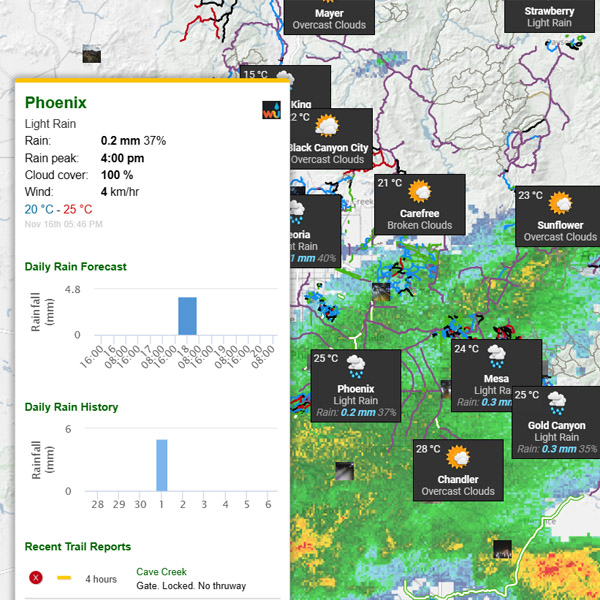
Trail Weather Map
The five day forecast plotted across the trail map, so you can see where conditions will actually be good before you decide where to ride.
Every ride starts with the same question: what is it going to be like out there? Instead of checking a forecast for a city and guessing how that translates to the trails, you read conditions across a whole riding area at once — laid over the same map you already use to find trails.
What the forecast shows
Five days ahead
Step through a five day window a day at a time and watch how a system moves across the area you ride.
Rain, and when it lands
Expected rainfall plus the peak time for it — the difference between a wet morning that dries out and a washout all afternoon.
Snow and temperature
Daily high and low with snowfall totals, so you know whether you are looking at hero dirt, a freeze-thaw mess, or a powder day.
Wind
Useful on exposed alpine and ridge trails, and for anyone choosing between a sheltered valley loop and a summit push.
Weather layers you can turn on
The forecast markers are the starting point. On top of them the map carries a set of weather overlays you can switch on individually, so you can look at exactly the conditions that matter for what you have planned.
Rain and radar
Precip Radar for what is falling right now, plus precipitation forecast overlays at 24, 48 and 72 hours for deciding how far ahead to commit.
Snow
Snow Depth for what is already on the ground, snowfall forecasts at 24, 48 and 72 hours, plus daily snow telemetry stations and ski resort reports.
Wildfire
Currently burning areas, real-time satellite fire detections, and historical burn zones for the US and Canada — useful long after a fire for knowing what the trails run through.
Smoke and air quality
Near-surface smoke concentration for today and at 24 and 48 hours, alongside current and next-day air quality — the deciding factor on a lot of late summer rides.
Webcams
Look at the sky over a trailhead instead of taking a forecast's word for it.
Everything on one map
Layers stack over the same trail data, so smoke, snow and rain can be read against the trails and routes you are actually considering.
Why look at weather on a map
Mountain weather is local. A forecast for the nearest town often has little to do with what is happening a few hundred metres higher, on the other side of a valley, or on the far side of a range. Seeing forecast markers spread across the map makes those differences obvious, and makes it easy to shift a plan a valley over rather than write off the day.
How riders use it
Pick the right zone this weekend
Compare several riding areas side by side and go where the weather is best, rather than defaulting to the closest trailhead.
Plan a road trip
Scan a whole region across the forecast window and decide which days to spend where before committing to the drive.
Time a shoulder-season ride
In spring and autumn the call is usually about freeze-thaw and rainfall. Both are on the map, next to the trails they affect.
Ride without wrecking trails
Wet trails damage easily. Checking rainfall before you go is the simplest way to avoid riding somewhere that should have been left to dry.
Getting to the Weather Map
The Weather Map is part of the Trailforks map — it opens as the Weather panel over the same trail data you already browse, so you can move between the forecast and trails, routes and reports without leaving the page. It is a Trailforks Pro feature, so you will need an account to use it.
Forecast tells you what is coming; trail reports tell you what riders actually found on the ground. Checking both is the reliable way to judge conditions — and if you are still deciding where to go, browse riding regions or open the full Trailforks map.
- prev feature
- next feature
Trail System Weather Map
View weather conditions & forecasts for trail systems around the world visually on the map. ALso view percip radar on the map.