-
DateSaturday July 5, 2025 at 9:00am NDT
past event -
TypeRaceXC
-
ActivitiesMountain Bike
-
Location
-
Route
-
Email
-
Website
-
RegistrationOpen Paid
-
Organizer
2025 MTB XCO Race at Prince Edward Park
July 5th, 2025
The West Coast Cycling Association is thrilled to announce our 2nd annual MTB XCO at Prince Edward Park, promising an exhilarating experience for riders of all levels. Set against the stunning backdrop of the parks scenic trails, this event will showcase the latest features built at the the skills park, providing a dynamic and challenging course for competitors. From seasoned riders seeking to test their limits to beginners eager to embrace the thrill of mountain biking, all are invited to participate in this inclusive and adrenaline-pumping race. With support from the Kinsmen Club, cycling community, and the dedication of organizers, the West Coast Cycling Association ensures that this XCO race will be a celebration of skill, camaraderie, and the pure joy of riding.
Categories and Laps (each lap is approximately 4km)
Under 11 - 1 Lap
Under 13 Men / Women - 2 Laps
Under 15 Men / Women - 3 Laps
U19 Men / Women - 3 Laps
Sport Men / Women - 4 Laps
Expert Men / Women - 5 Laps
9:00 - Race check in
9:30 - U11 & U13 start
10:30 - All other categories start
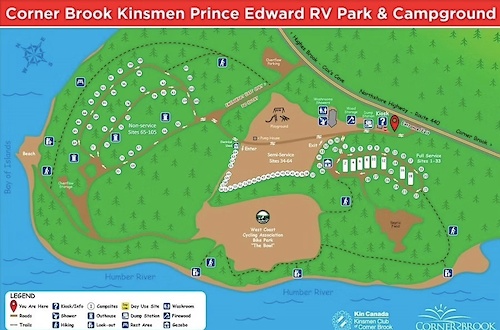
Parking: Please park in the upper parking lot just past the main entrance. Please ensure that you do not block the entrance of the parking lot.
Kinsmen Prince Edward Campground and RV Park will be opening May 23, 2025 and closing September 30, 2025.
Book now at [email protected] or call 709-637-1580
Comments
-
+ 1
 grandynl
Jul 8, 2025 at 10:39
grandynl
Jul 8, 2025 at 10:39
-
- Signup Link
- Download
- Subscribe
-
1interested
-
1going
Event Photos

Route
-
2025 WCCA XCO (Expert)
close-
Layers w
- Weather Layers
- Pro
- Pro
- Pro
- Pro
- Pro
- Pro
- More Layers
- Pro
- Pro
- Pro
- Pro
-
Upgrade to

3DTrail Conditions- Unknown
- Snow Groomed
- Snow Packed
- Snow Covered
- Snow Cover Partial
- Freeze/thaw Cycle
- Icy
- Prevalent Mud
- Wet
- Variable
- Ideal
- Dry
- Very Dry
Trail Flow (Ridden Direction)Trailforks scans users ridelogs to determine the most popular direction each trail is ridden. A good flowing trail network will have most trails flowing in a single direction according to their intension.
The colour categories are based on what percentage of riders are riding a trail in its intended direction.- > 96%
- > 90%
- > 80%
- > 70%
- > 50%
- < 50%
- bi-directional trail
- no data
Trail Last RiddenTrailforks scans ridelogs to determine the last time a trail was ridden.- < 2 days
- < 1 week
- < 2 weeks
- < 1 month
- < 6 months
- > 6 months
Trail Ridden DirectionThe intended direction a trail should be ridden.- Downhill Only
- Downhill Primary
- Both Directions
- Uphill Primary
- Uphill Only
- One Direction
Contribute DetailsColors indicate trail is missing specified detail.- Description
- Photos
- Description & Photos
- Videos
Trail Popularity ?Trailforks scans ridelogs to determine which trails are ridden the most in the last 9 months. Trails are compared with nearby trails in the same city region with a possible 25 colour shades. Think of this as a heatmap, more rides = more kinetic energy = warmer colors.- most popular
- popular
- less popular
- not popular
ATV/ORV/OHV FilterMax Vehicle WidthinchesUS Cell CoverageLegend
Radar TimeActivity RecordingsTrailforks uses anonymized public activity data. ?Activity RecordingsTrailforks uses anonymized public activity data. ?Personal Heatmap▶ Activity Typesall / none▶ Options2Date range month–Winter TrailsWarning A routing network for winter maps does not exist. Selecting trails using the winter trails layer has been disabled.Missing TrailsMost PopularLeast PopularTrails are colored based on popularity. The more popular a trail is, the more red. Less popular trails trend towards green.Jump Magnitude HeatmapHeatmap of where riders jump on trails. Zoom in to see individual jumps, click circles to view jump details.BC Backroad Status
Service Road Atlas is a free to use, community-driven service for viewing and creating reports on the numerous back-country service roads around B.C. and Alberta.
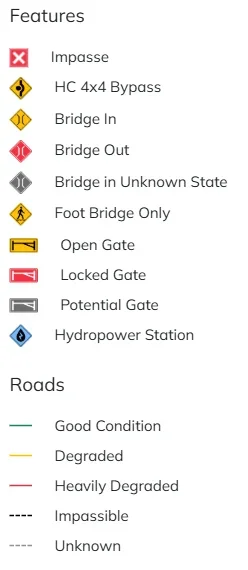
![map legend]() Slope AspectDirection the slope facesTrails DeemphasizedTrails are shown in grey.Only show trails with no bike usage.Suggested LayersBased on selected activity type
Slope AspectDirection the slope facesTrails DeemphasizedTrails are shown in grey.Only show trails with no bike usage.Suggested LayersBased on selected activity typeSave the current map location and zoom level as your default home location whenever this page is loaded.
SaveTrail transparency12.0 milesDistance886 ftClimb-882 ftDescent112 ftHigh Point4 ftAltitude change31 ftAltitude min32 ftAltitude start36 ftAltitude end-26.6%Grade max23.6%Grade min4 milesDistance climb4 milesDistance down4 milesDistance flat -
- By grandynl

- #17161 - 211 views