
Weather App for Hiking & Bikinglive radar, wind, snow & forecasts on the trail map
Know what the weather is doing on the trail, not just in town. Trailforks puts live radar, lightning, hourly forecasts, snow lines and air quality on the same map as the trails, and adds a forecast to every region and trail page.
- 25weather map layers
- 48hour forecast timeline
- 5minute live radar updates
- 5day city forecasts
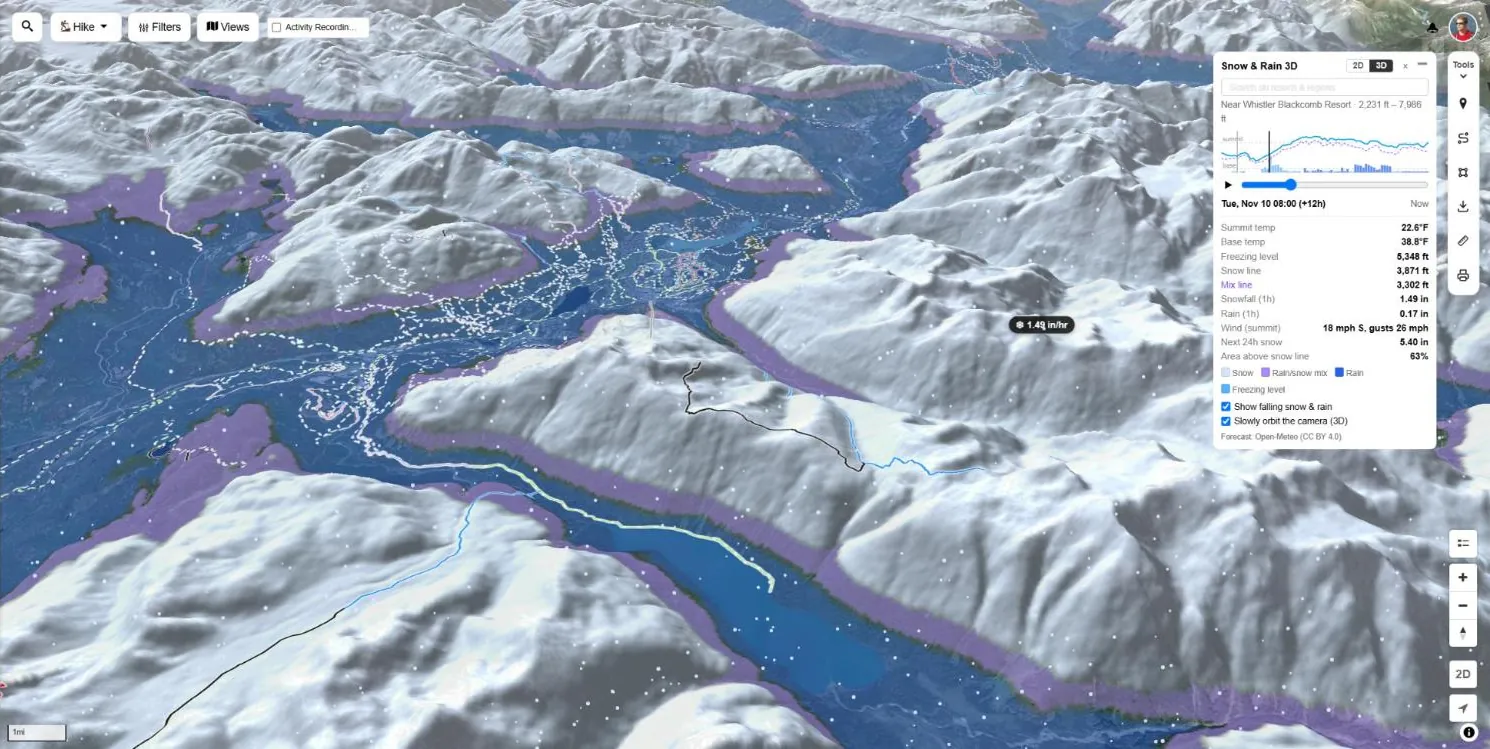
Hourly weather forecast on the trail map
Turn on any mix of weather layers and they all share one Weather Timeline: 24 hours back and 24 hours ahead, hour by hour. Press play to watch the storm cross the range, or drag to the hour you plan to start.
- Hover for values — rain, temperature, wind and gusts under your cursor
- Animated wind — wind particles flow across the map with any forecast layer on
- Global coverage — forecast models for the whole world, not just North America
- Your units — °F, mph and inches or °C, m/s and millimetres
- Stacks with trails — weather sits under the trail lines, so you see both
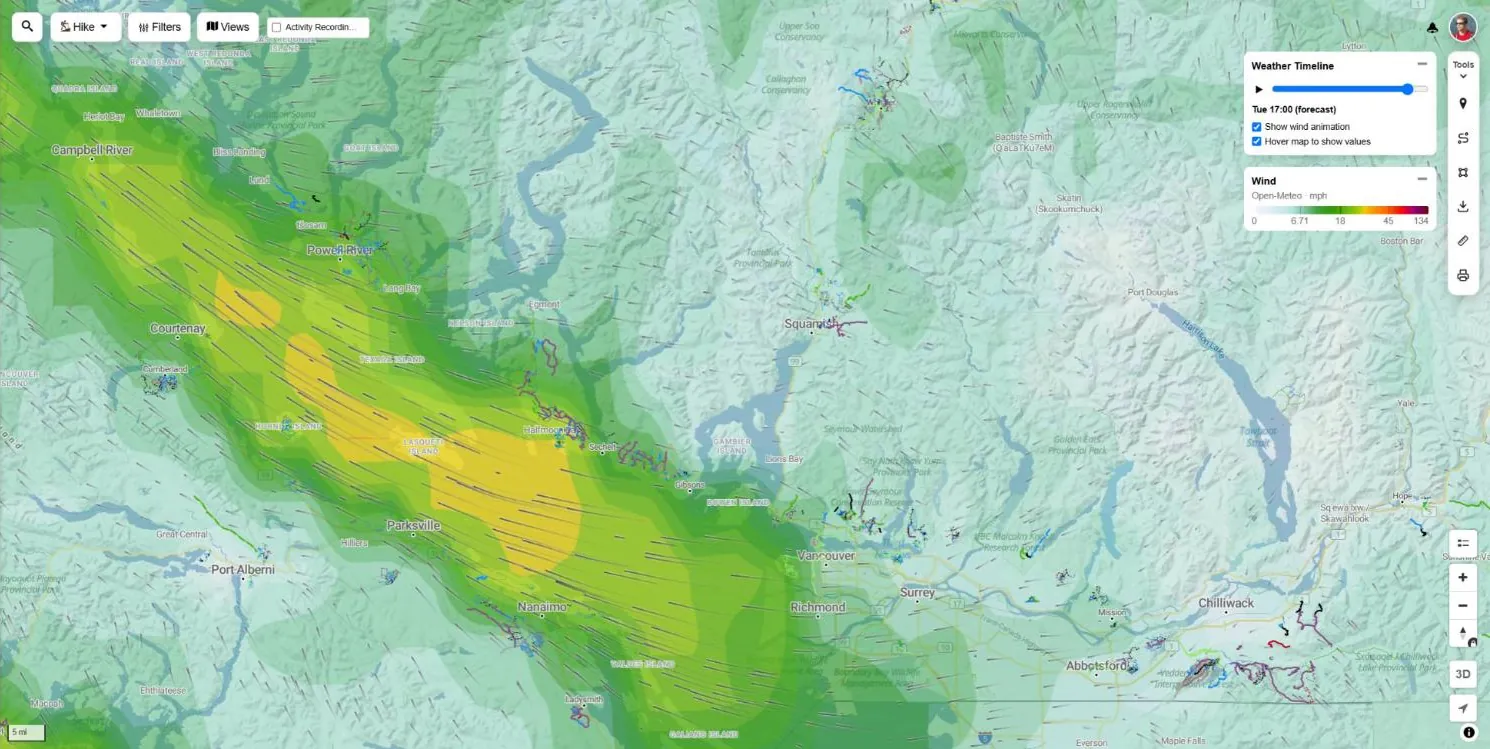
Live weather radar, lightning & satellite
What is happening right now, from real radar, lightning detection networks and weather satellites. Each layer loops through recent frames so you can see which way the weather is moving.
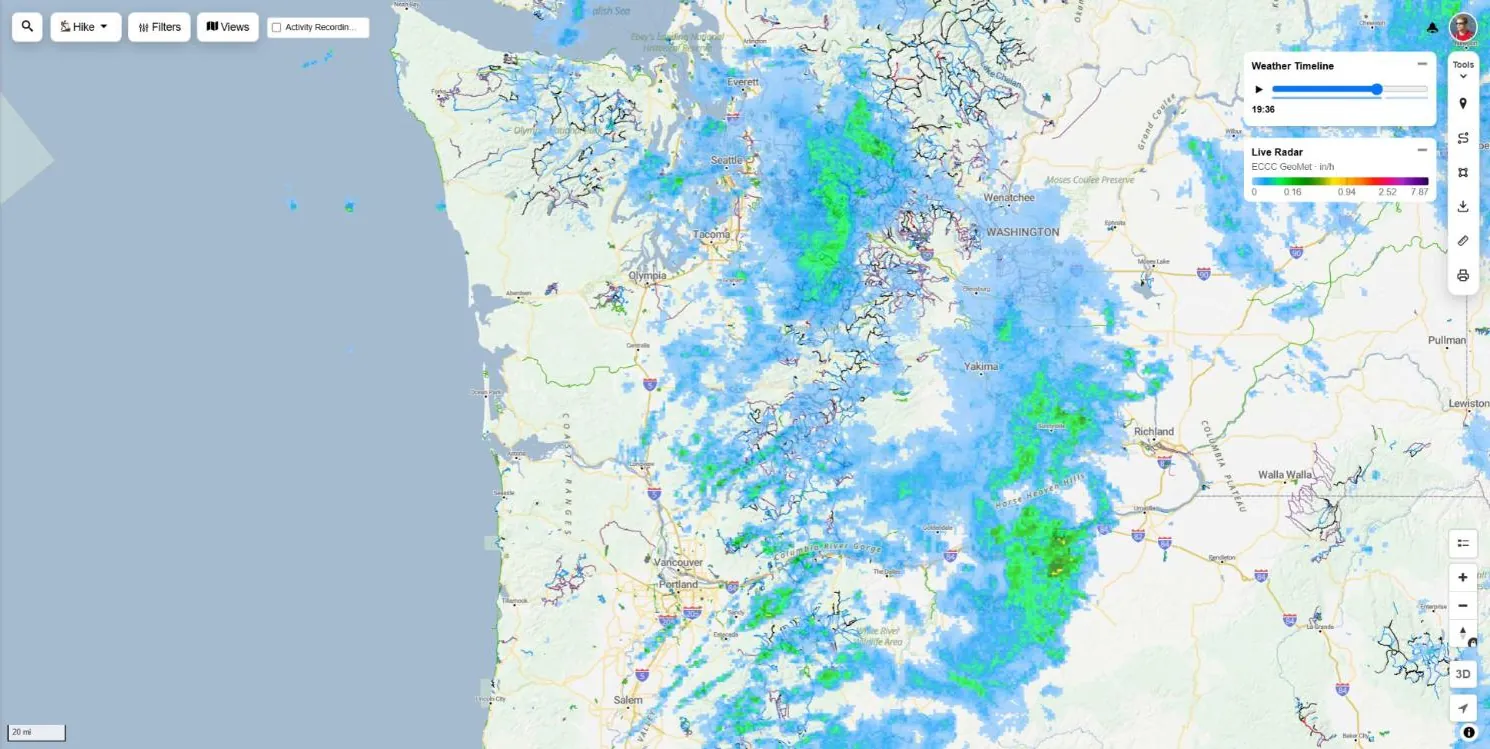
Live Precipitation Radar
Real radar scans for Canada, the United States and Europe, refreshed every 5 to 6 minutes. Play back the last 3 hours and a short nowcast of where the rain is heading next.
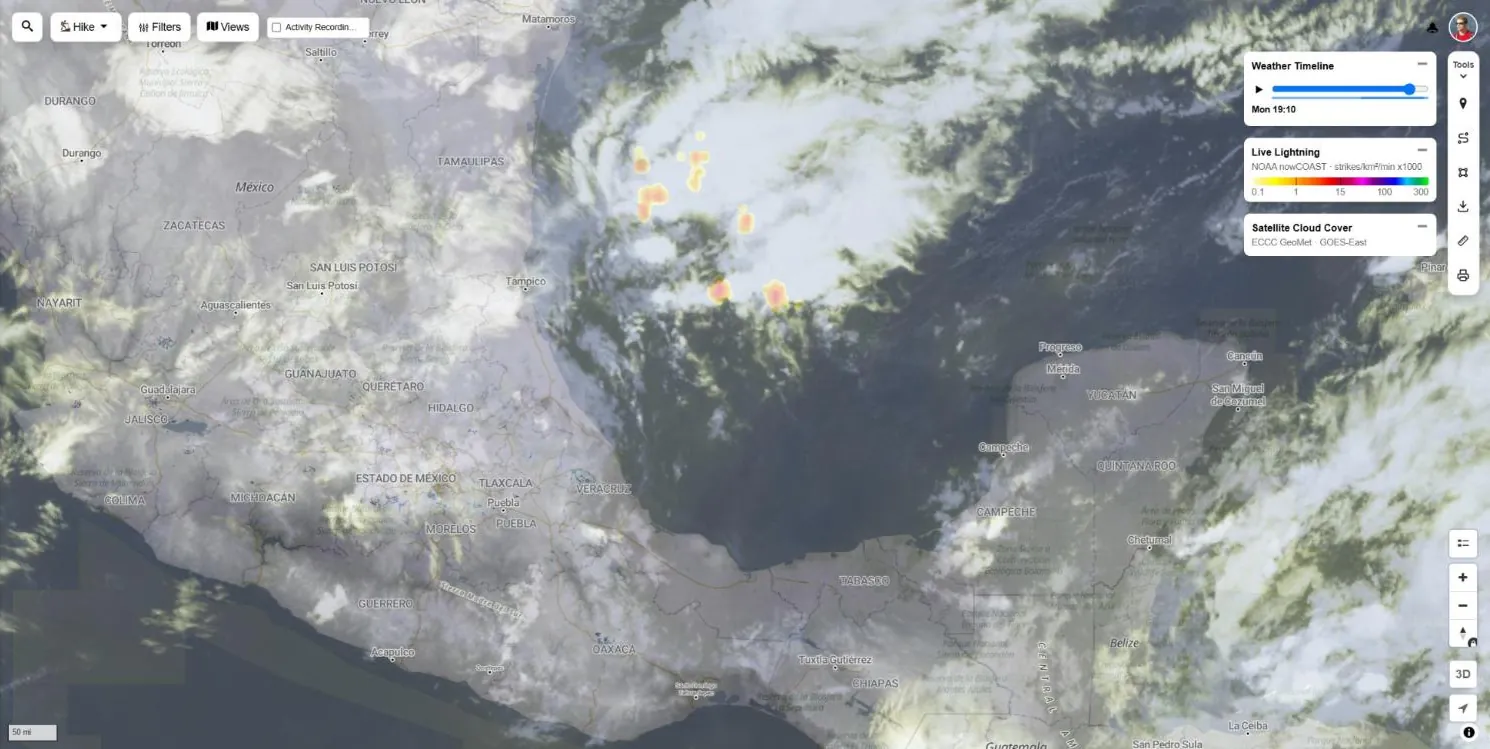
Live Lightning
Lightning strike density from NOAA, the Canadian lightning network and EUMETSAT. Check for storms building over the ridge before you head above treeline.
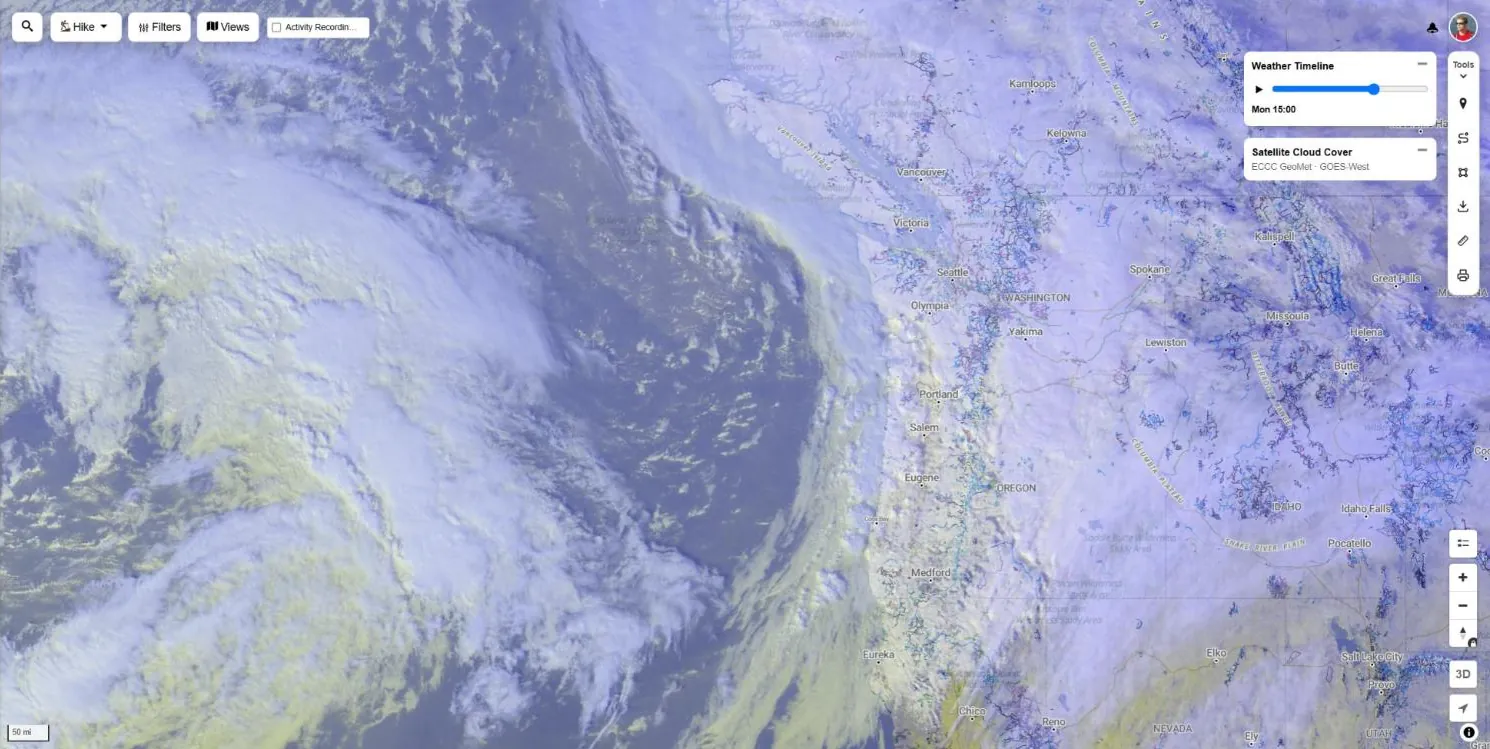
Live Satellite Cloud Cover
GOES and Meteosat imagery every 10 minutes with 24 hours of playback. Visible clouds by day and infrared by night, so you can watch a front roll in.
Mountain weather forecast layers
Rain, temperature, wind, clouds and freezing level from global forecast models, drawn as smooth hourly layers that follow the terrain. Plan the dry window, the calm ridge or the warm side of the valley.
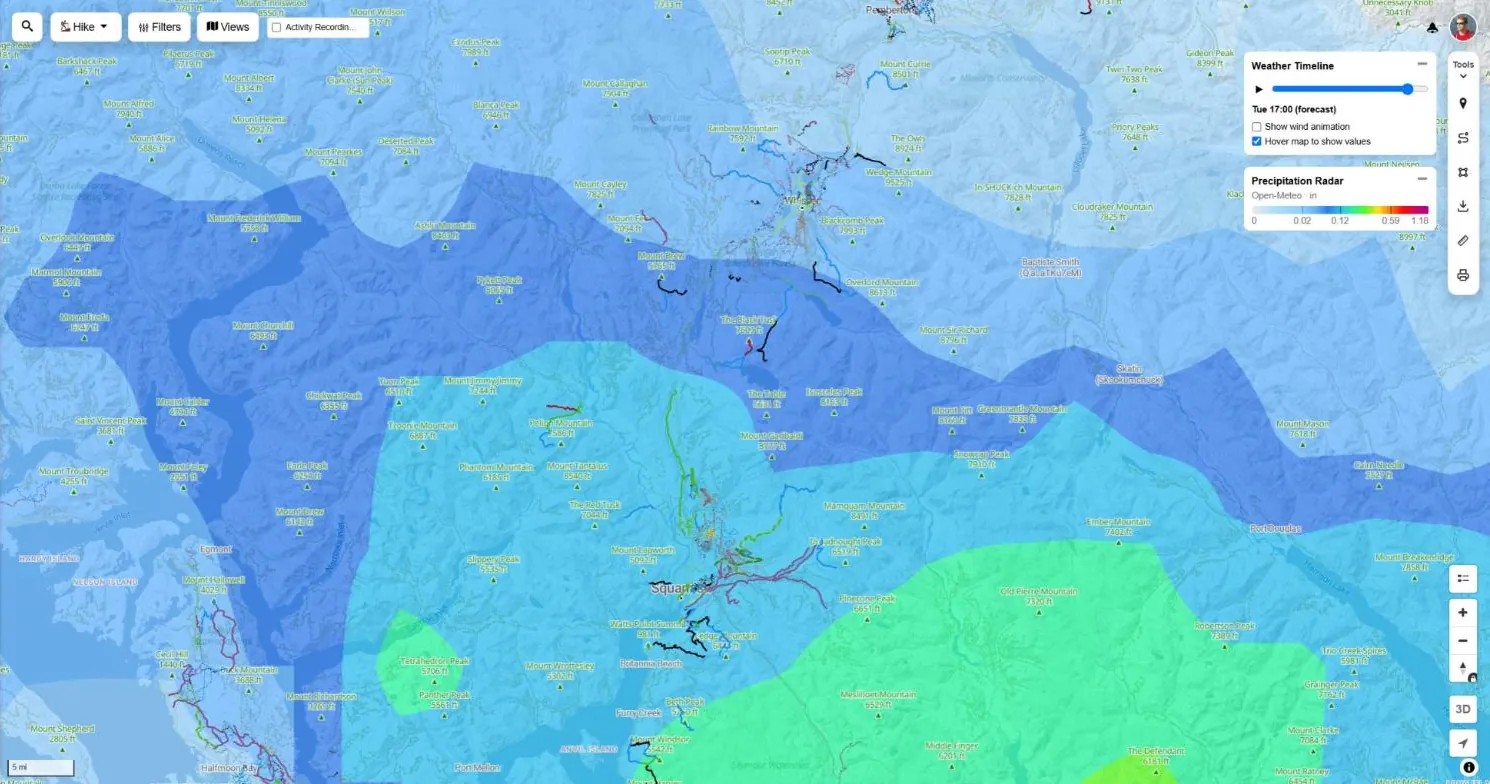
Precipitation Forecast Radar
Hour by hour rain and snow intensity for the next 24 hours, plus the last 24, anywhere in the world.
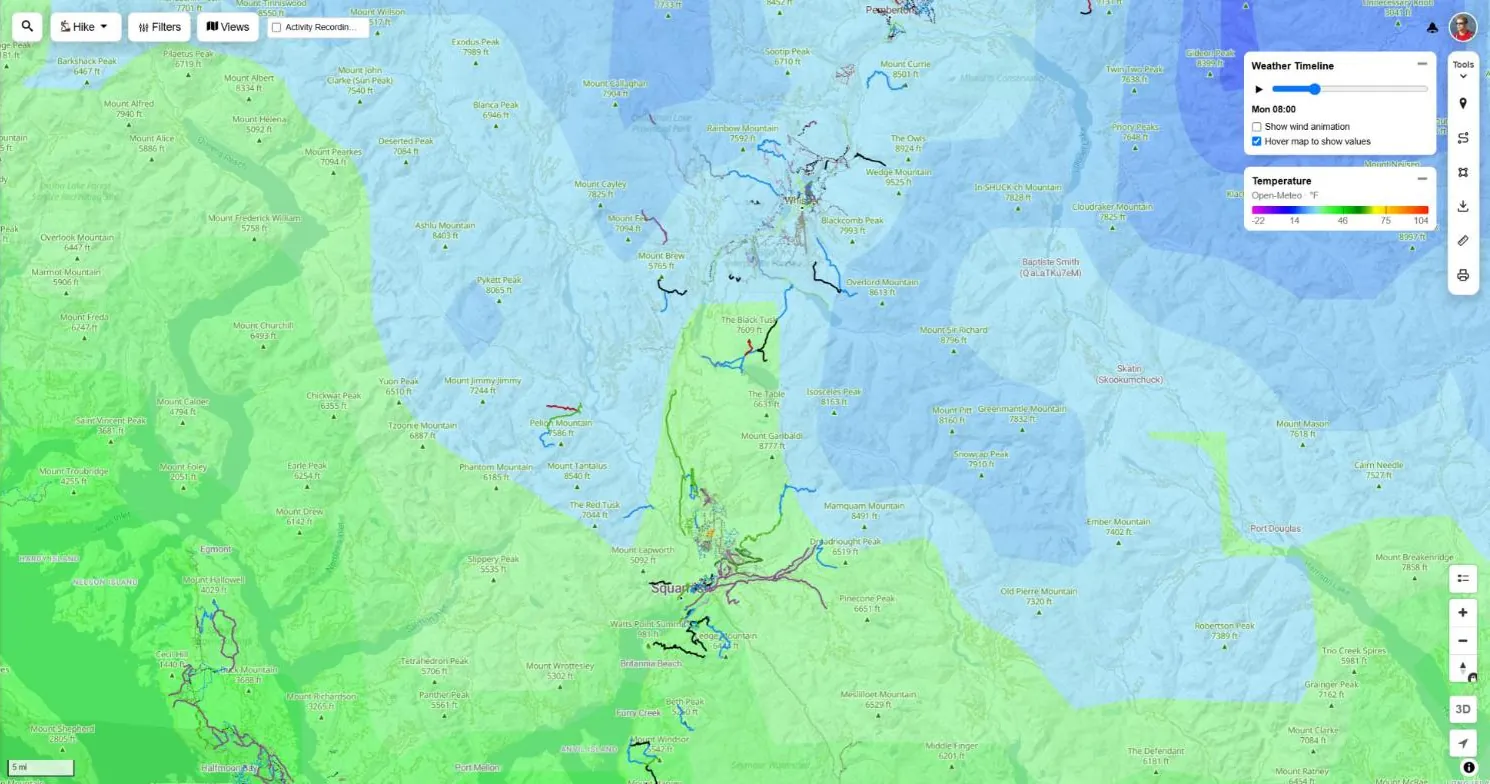
Temperature
Air temperature that follows the terrain, so you can see how cold it will be up high compared to the trailhead.
Wind
Wind speed and direction with animated wind particles. Hover anywhere for the speed and compass direction.
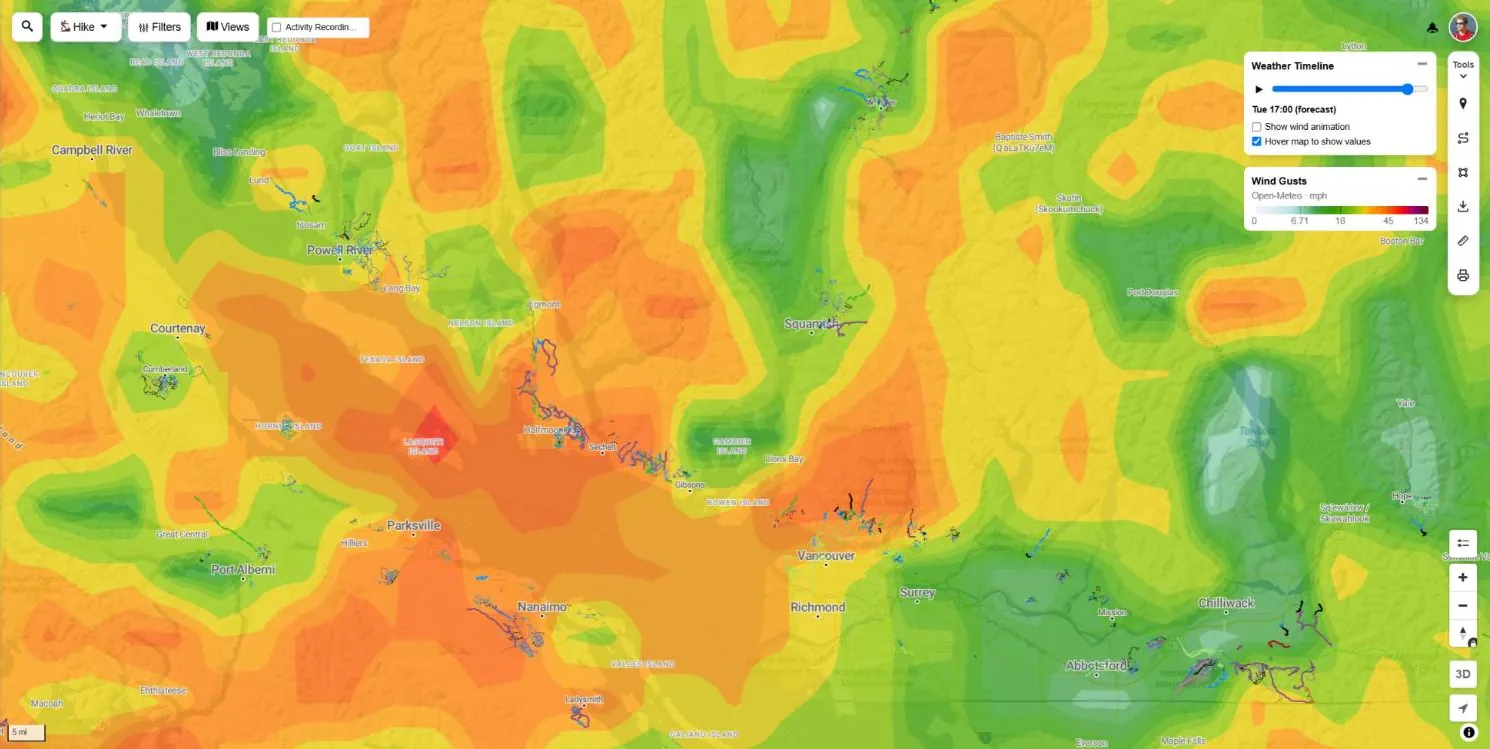
Wind Gusts
Peak gusts, the number that matters on exposed ridges, open alpine and bike-park lifts.
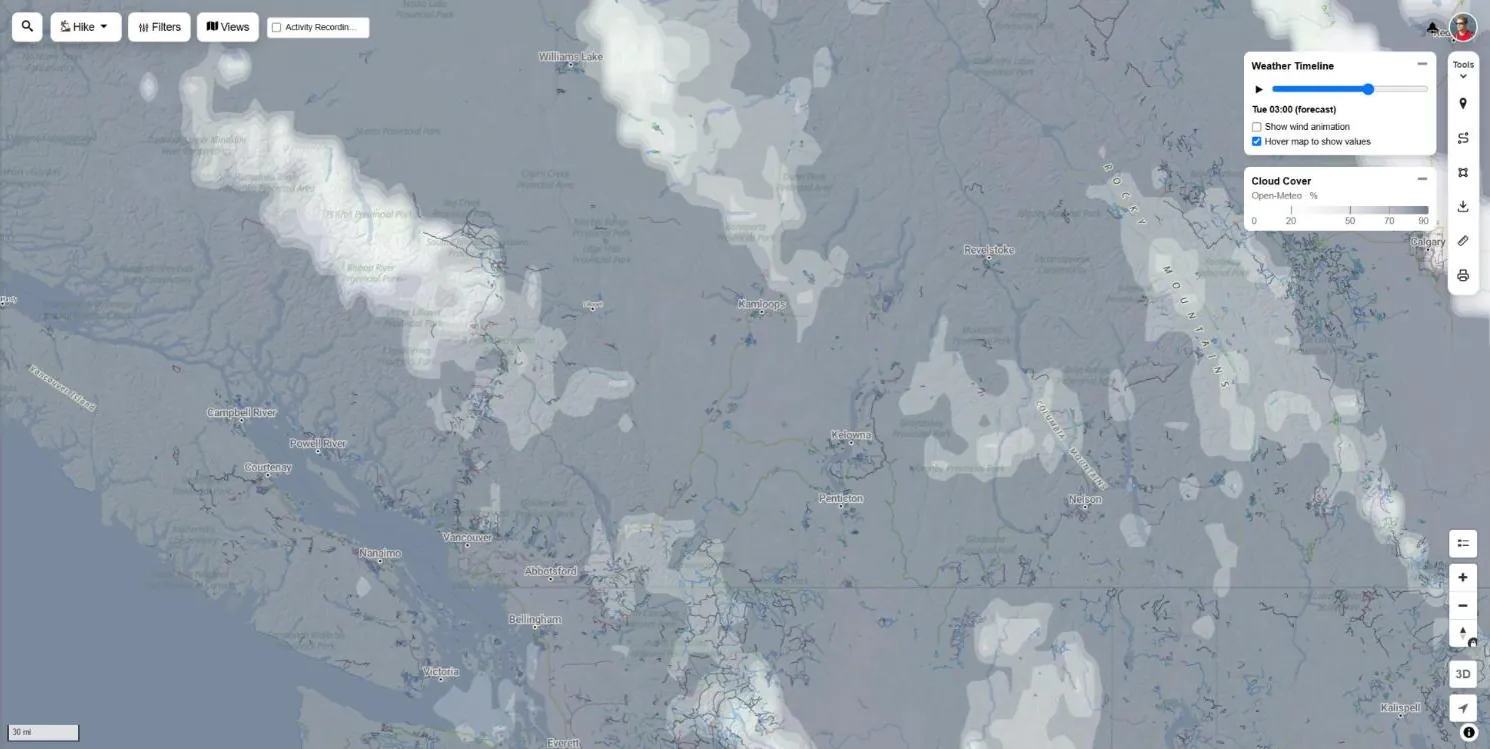
Cloud Cover
Forecast cloud cover by the hour. Find the clear window for summit views or a sunset ride.
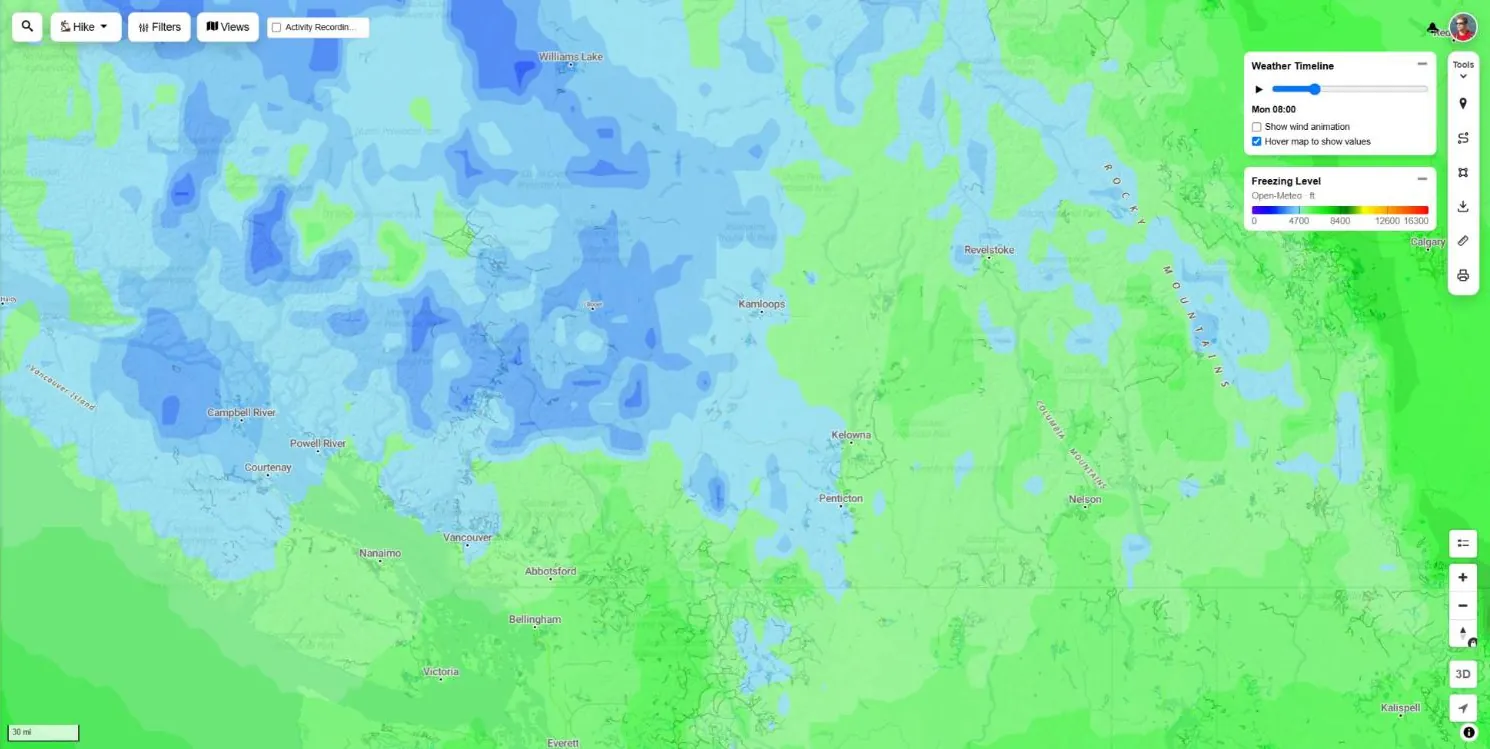
Freezing Level
The height where rain turns to snow. Know if the alpine trails will be white before you drive up.
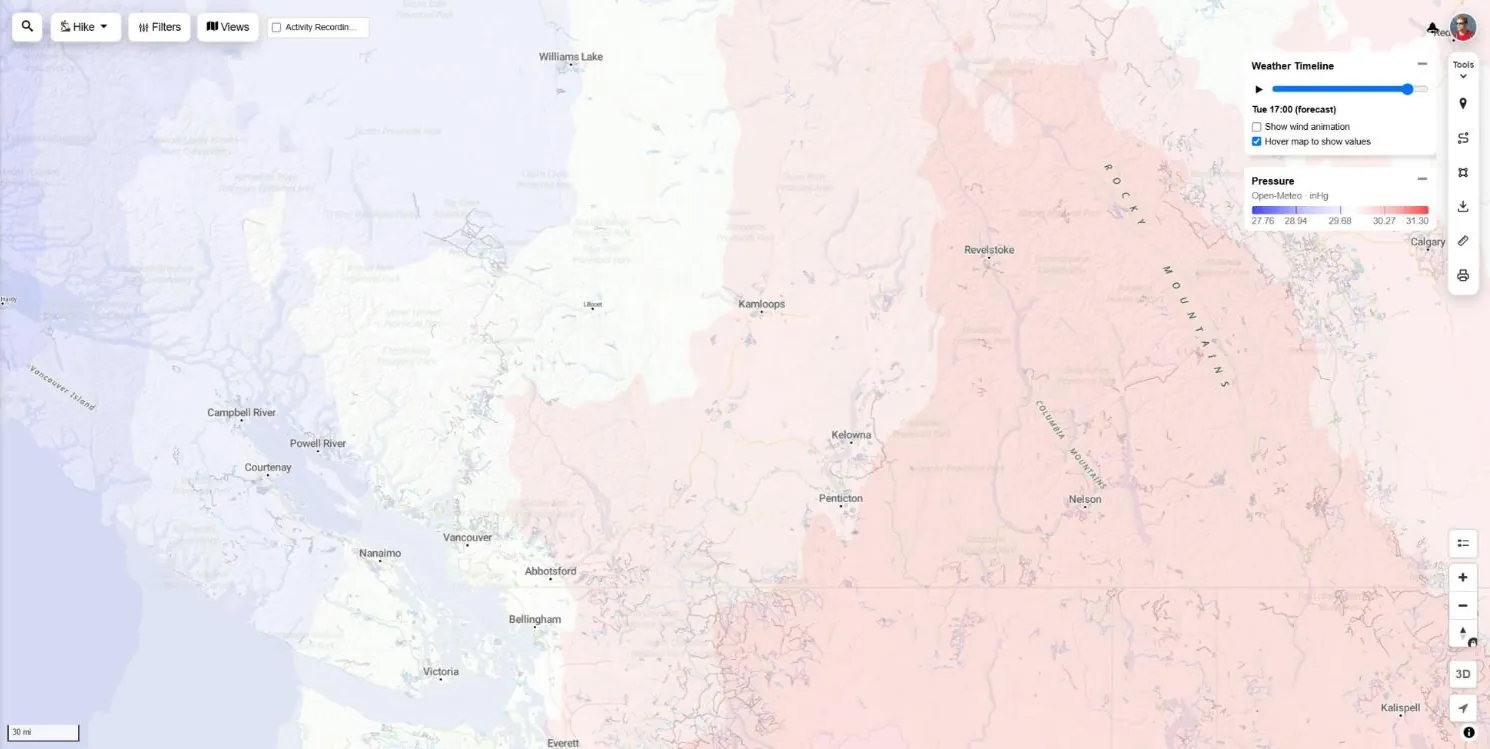
Pressure
Sea level pressure to spot incoming lows and highs, the big picture behind the forecast.
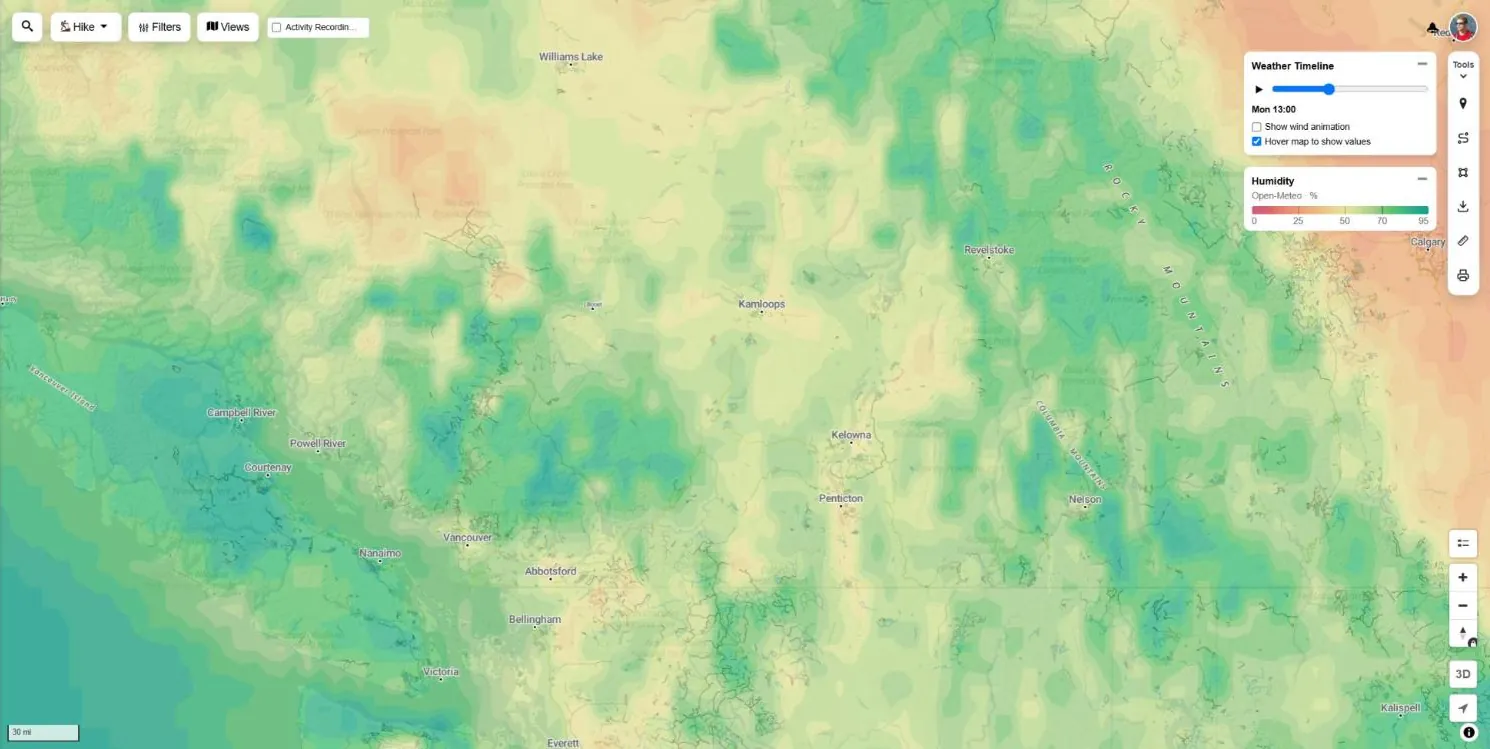
Humidity
Relative humidity by the hour, useful for heat stress on long climbs and for drying trails.
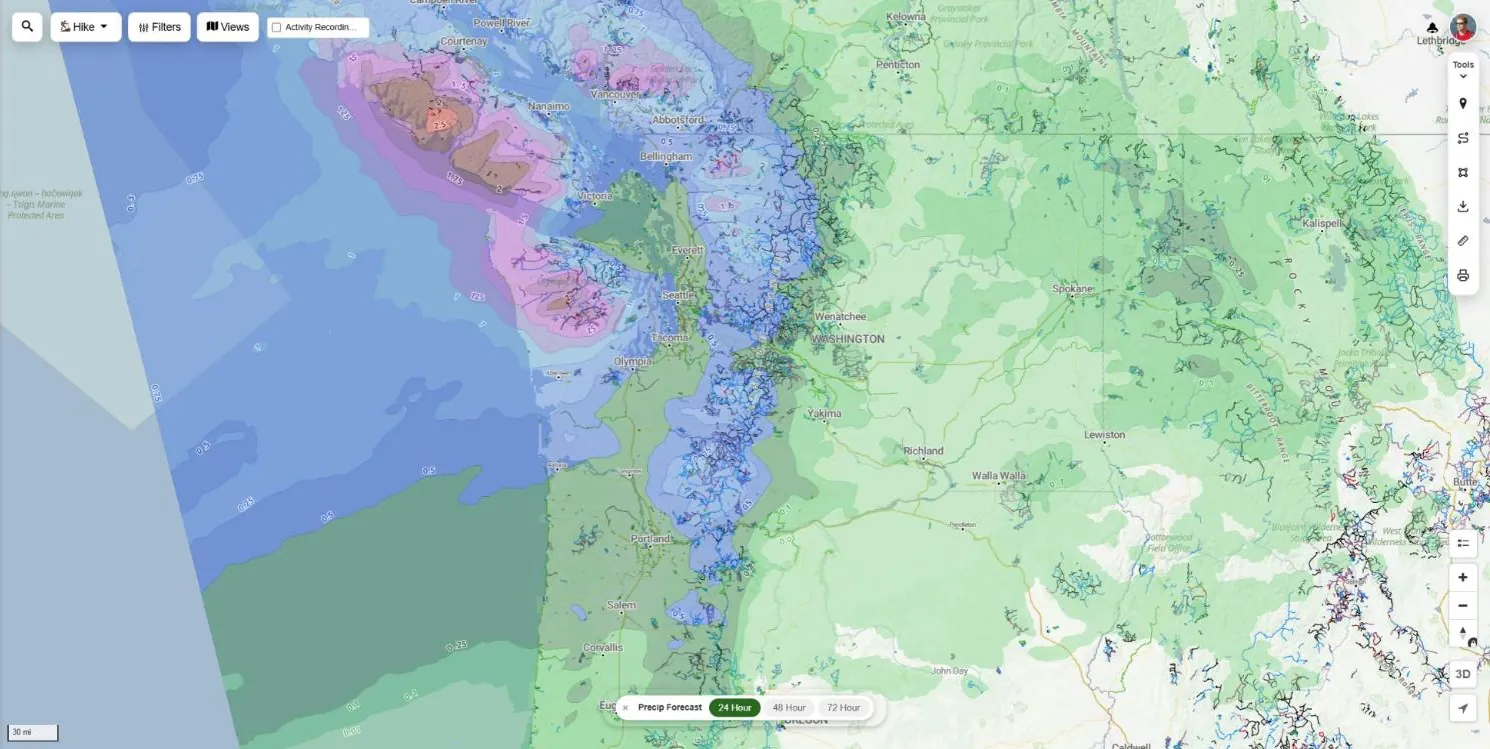
Precip Forecast Totals
Total rain expected over the next 24, 48 or 72 hours across the United States. See which trails will dry out first.
Snow forecast & snow depth maps
Find out where the snow is falling, how much is on the ground and whether the high trails have melted out. Built for backcountry skiers, snowshoers and riders chasing the last dry trails of the year.
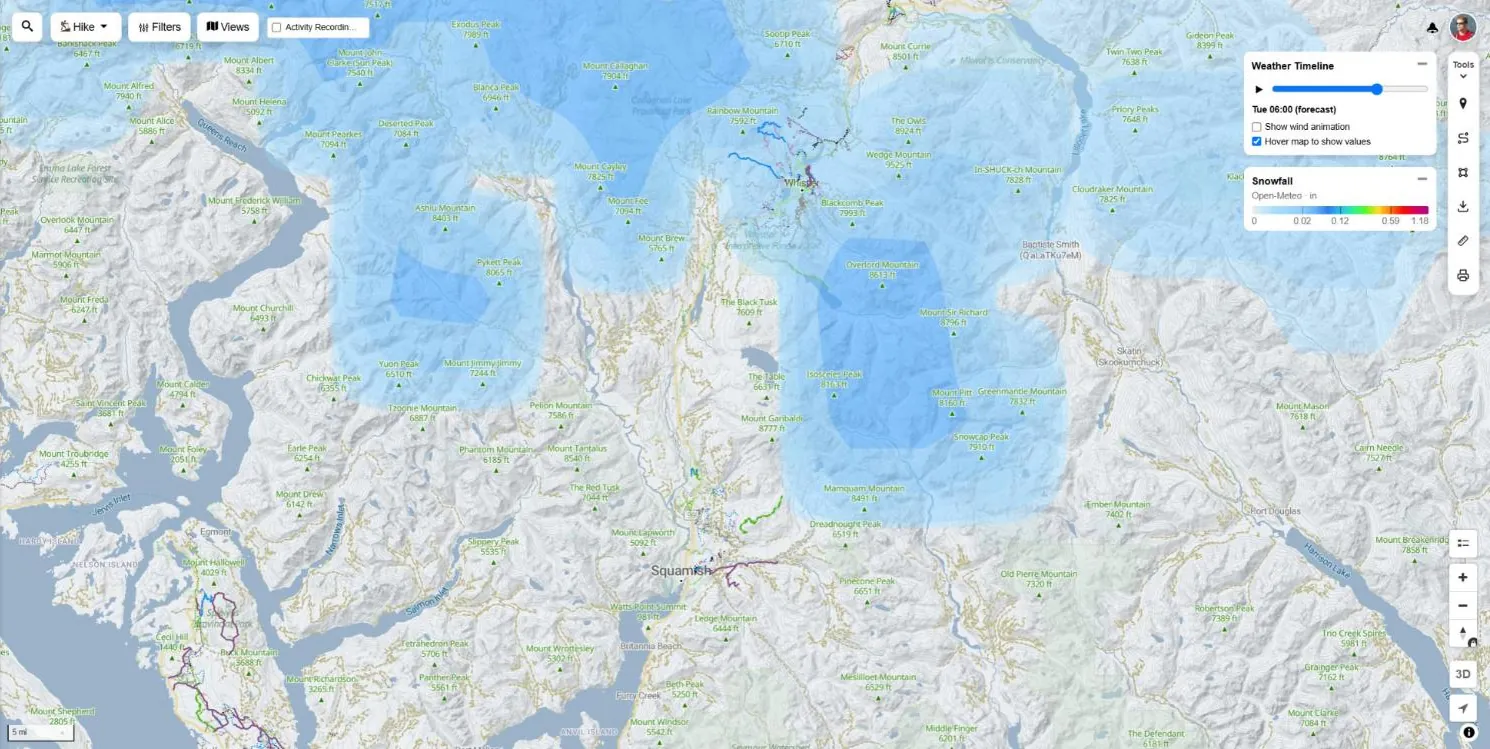
Snowfall
Hourly snowfall forecast on the shared weather timeline. Watch the storm move across the range.
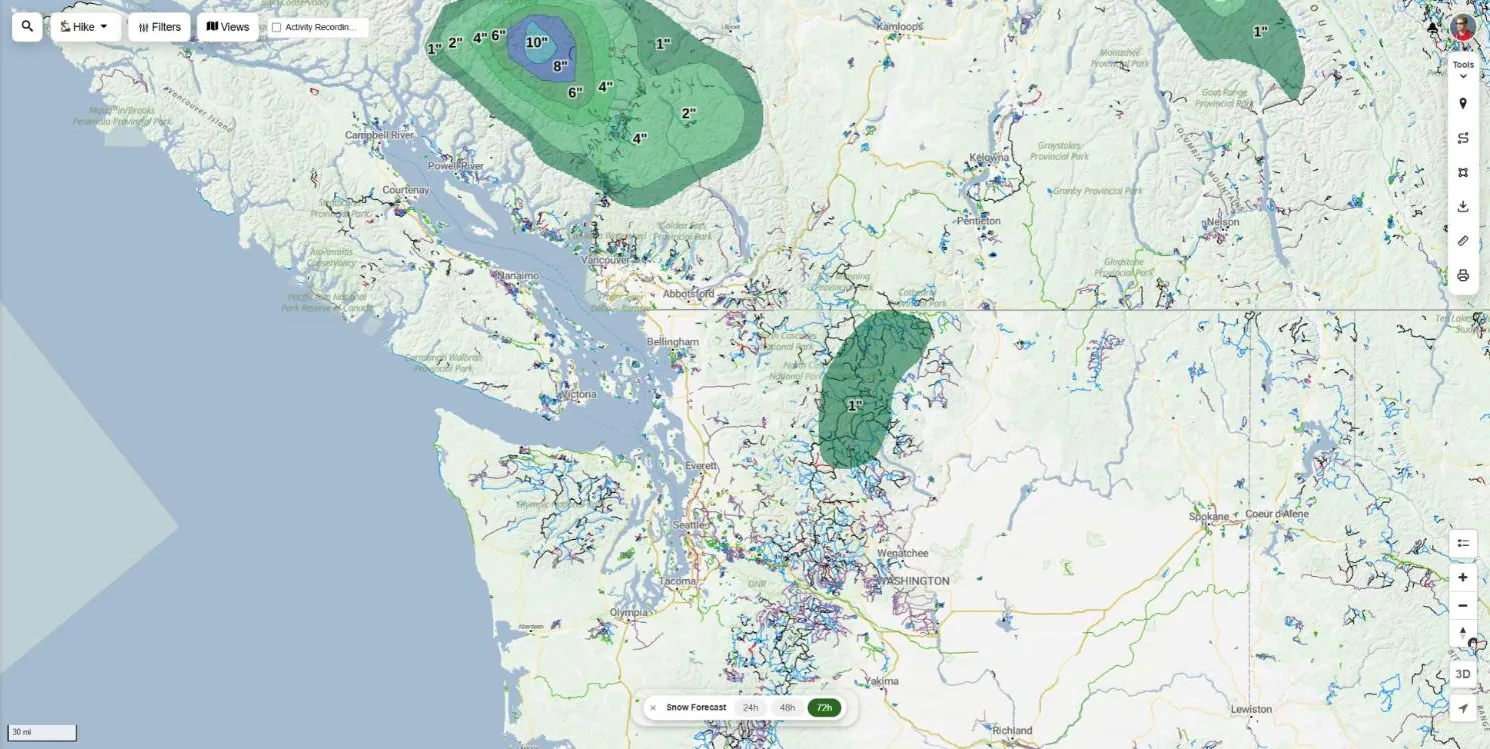
Snow Forecast Totals
Expected snow totals for the next 24, 48 or 72 hours. Plan the powder day or the last dry ride of the season.
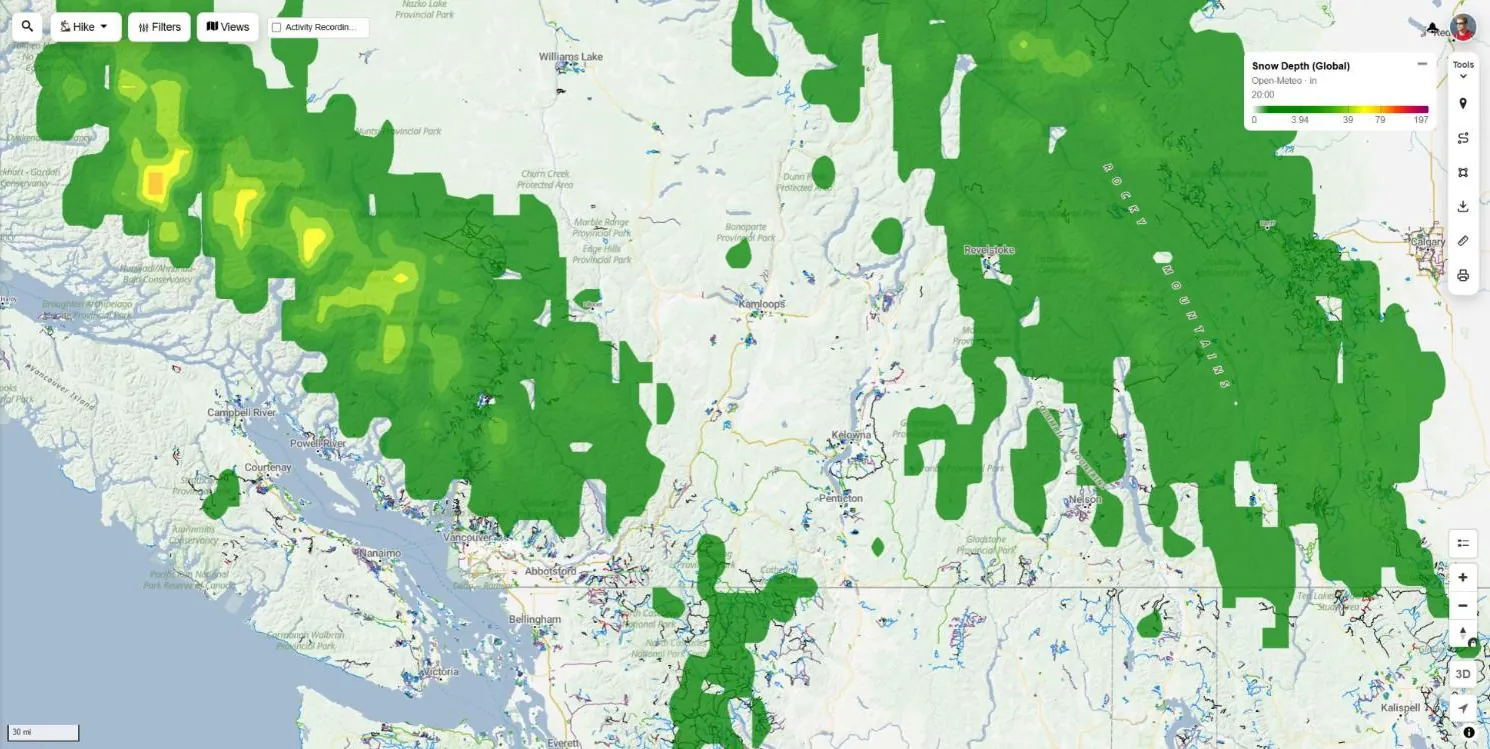
Snow Depth (Global)
Modelled snow on the ground anywhere in the world. Find out if the high trails have melted out yet.
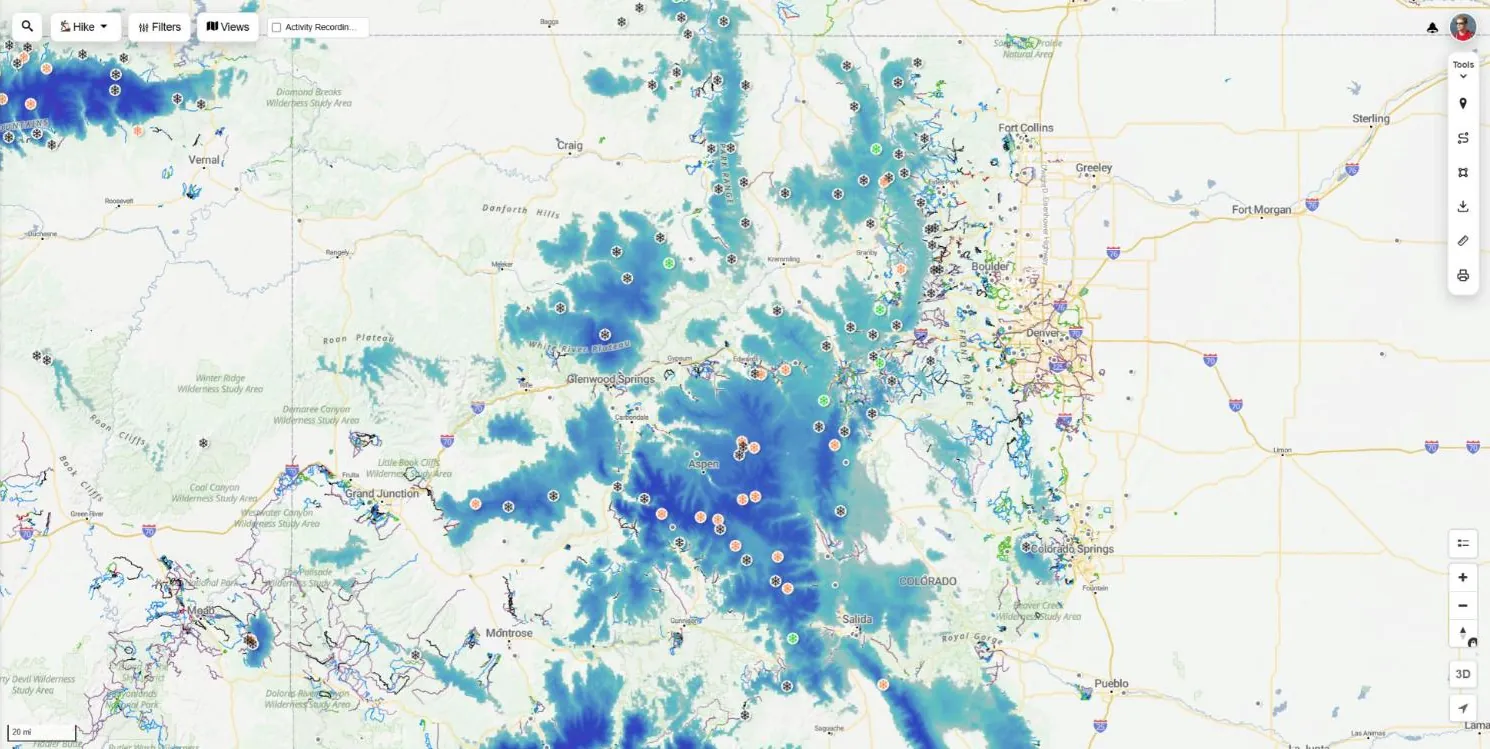
Snow Stations & Snow Depth
Daily readings from SNOTEL snow stations plus the US snow depth analysis. Real measured snow, not just a model.
Avalanche forecast Free
Danger ratings from Avalanche Canada and avalanche.org forecast centres, by alpine, treeline and below treeline. Also on its own avalanche map.
Ski resort reports Pro
Ski resort markers with the latest snow report during the season.
Winter on the reports tab Free
For winter activity types, a region's Reports tab adds the local avalanche danger next to the forecast.
Wildfire, smoke & air quality maps
Check fire perimeters, smoke and air quality before you load the car in fire season.
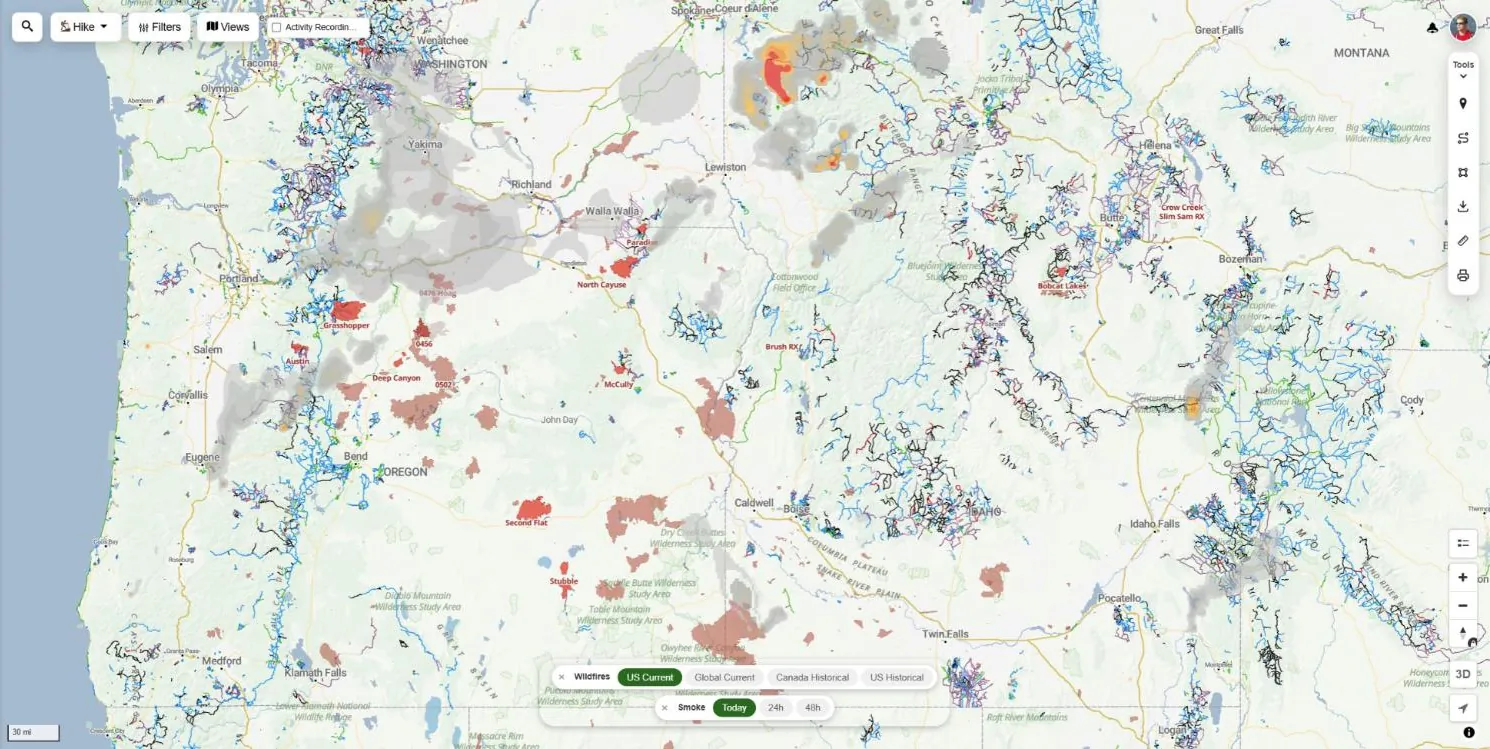
Wildfires & Smoke Forecast
Current fire perimeters and satellite fire detections, with a smoke forecast for today, 24 and 48 hours. Current wildfires and satellite detections are free.
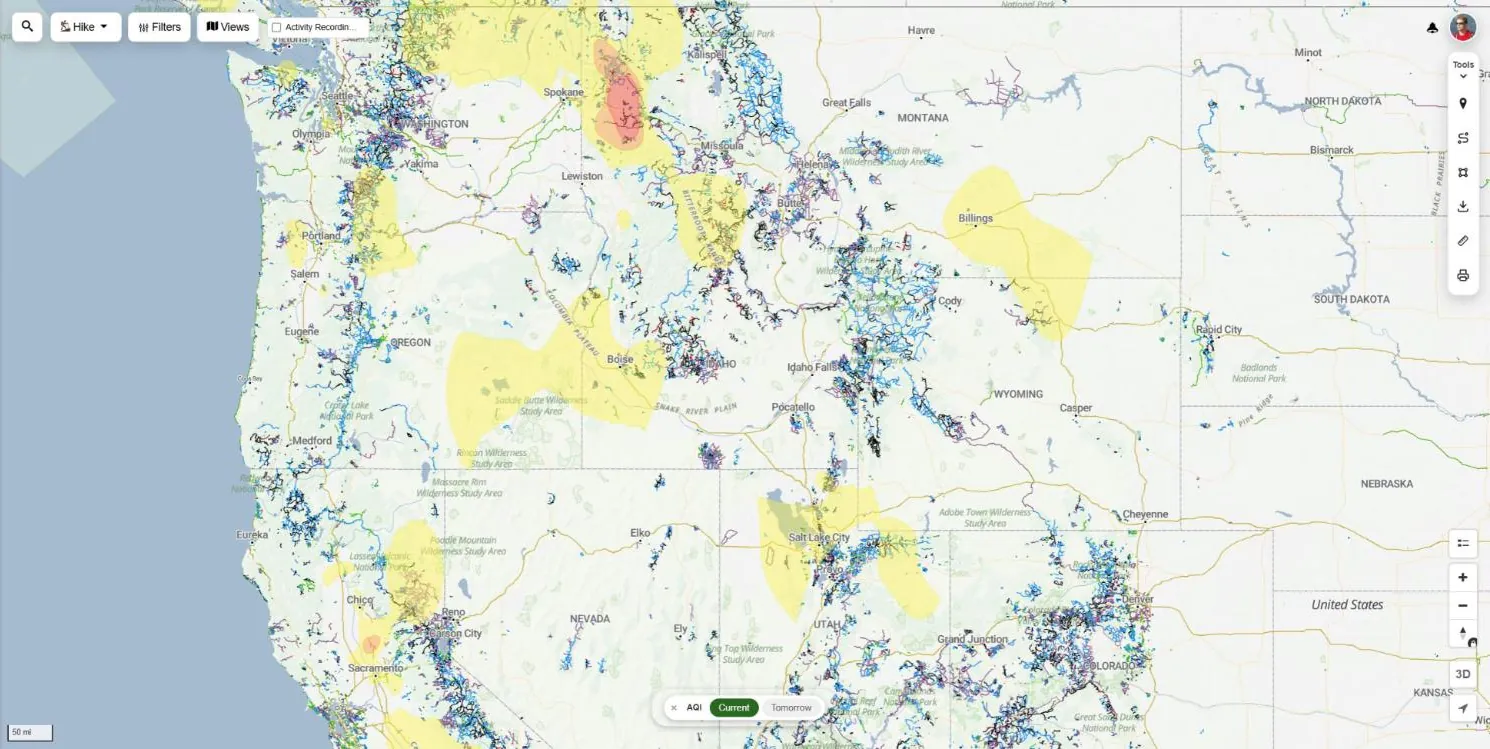
Air Quality (AQI)
Air quality index today and tomorrow, so you can decide if it is a day to push hard or stay low. Current air quality is free.
The Weather panel
Open Weather from the map's side menu to turn on the most useful layers in one click and compare the forecast for every town in view.
- Suggested layers: forecast cities, webcams, live radar and precip totals
- 5-day picker, today plus the next four days
- Rain, chance of rain, snow, low and high for each town, sortable
- Rain from the day before, to judge how wet the trails are
- Jump to any region from the search box
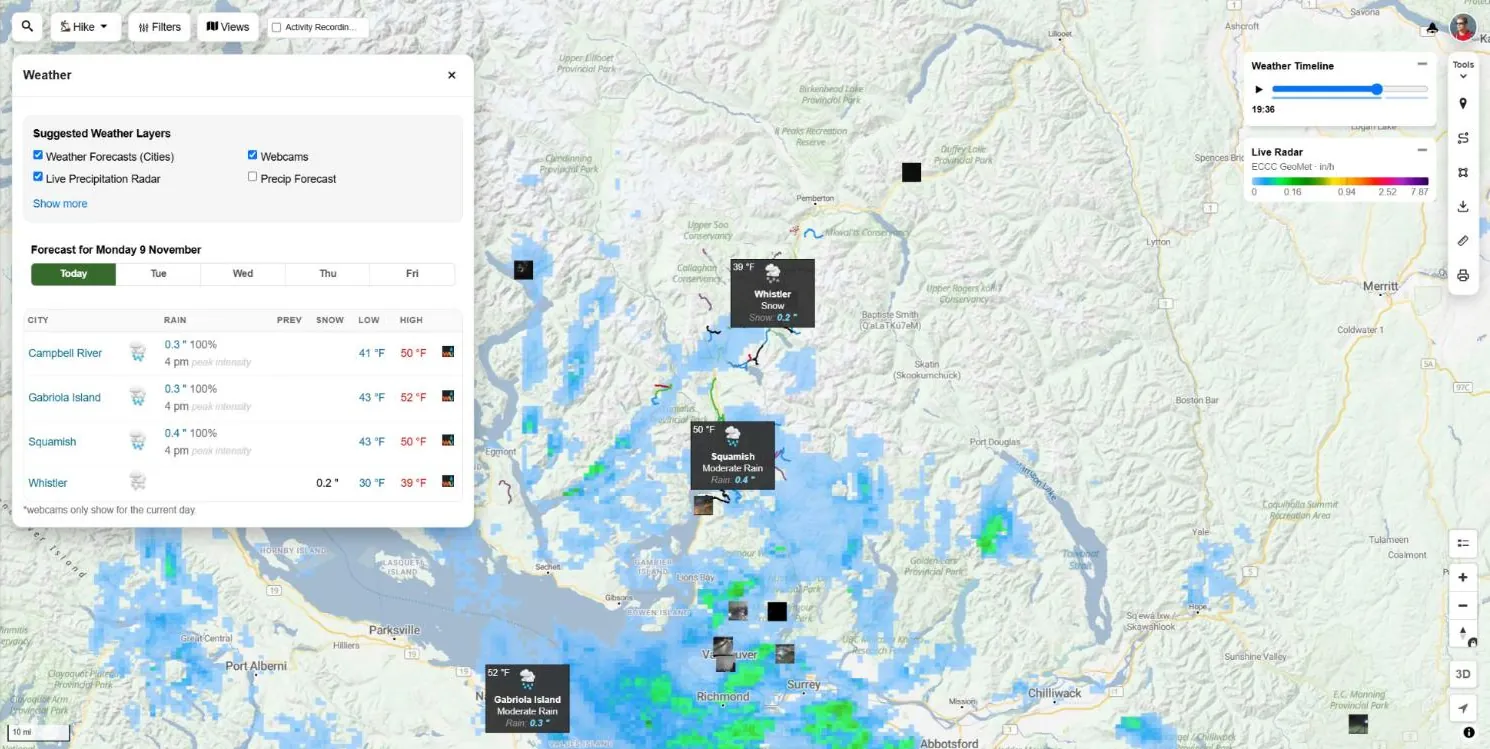
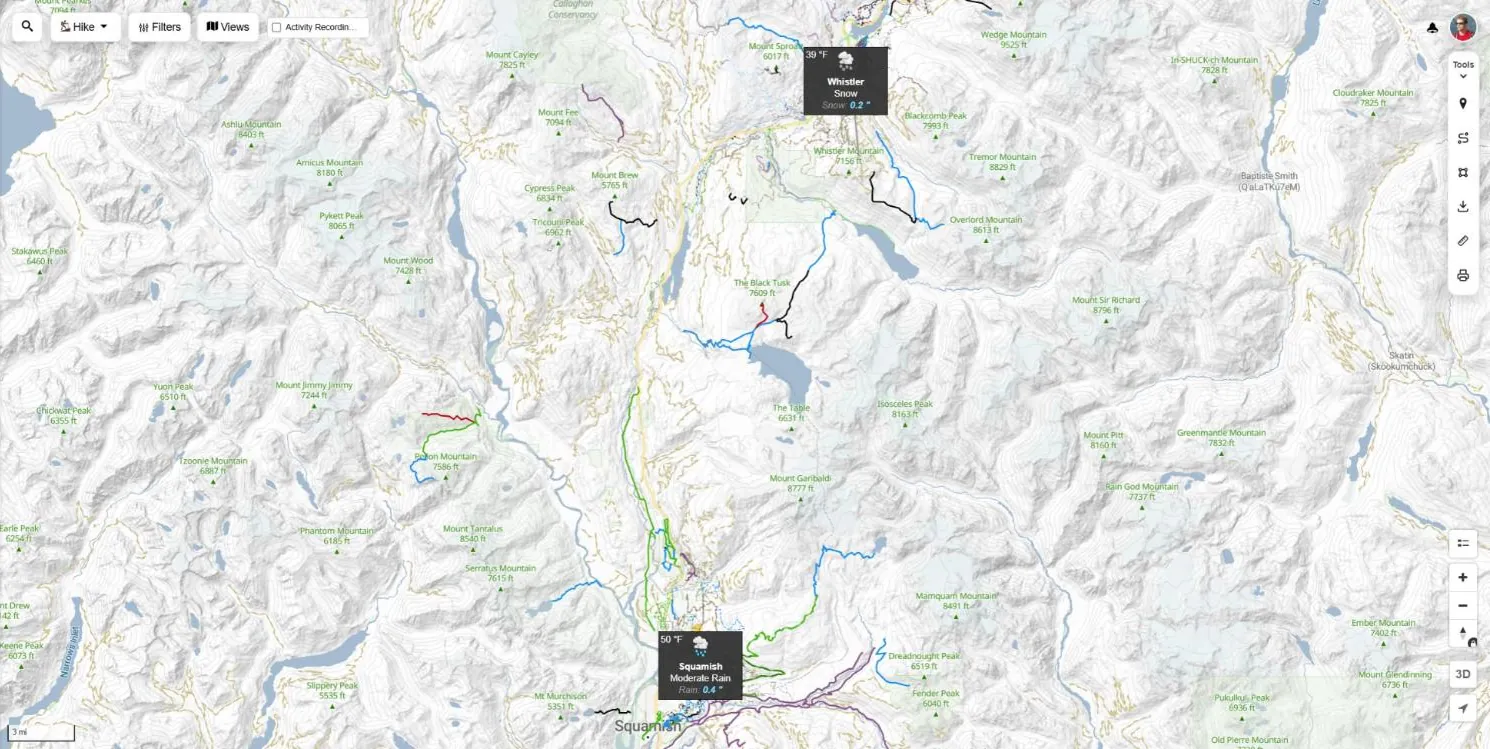
Forecast city markers
Temperature, conditions and rain or snow for nearby towns, right on the map. Click a marker for the details and a daily rain chart.
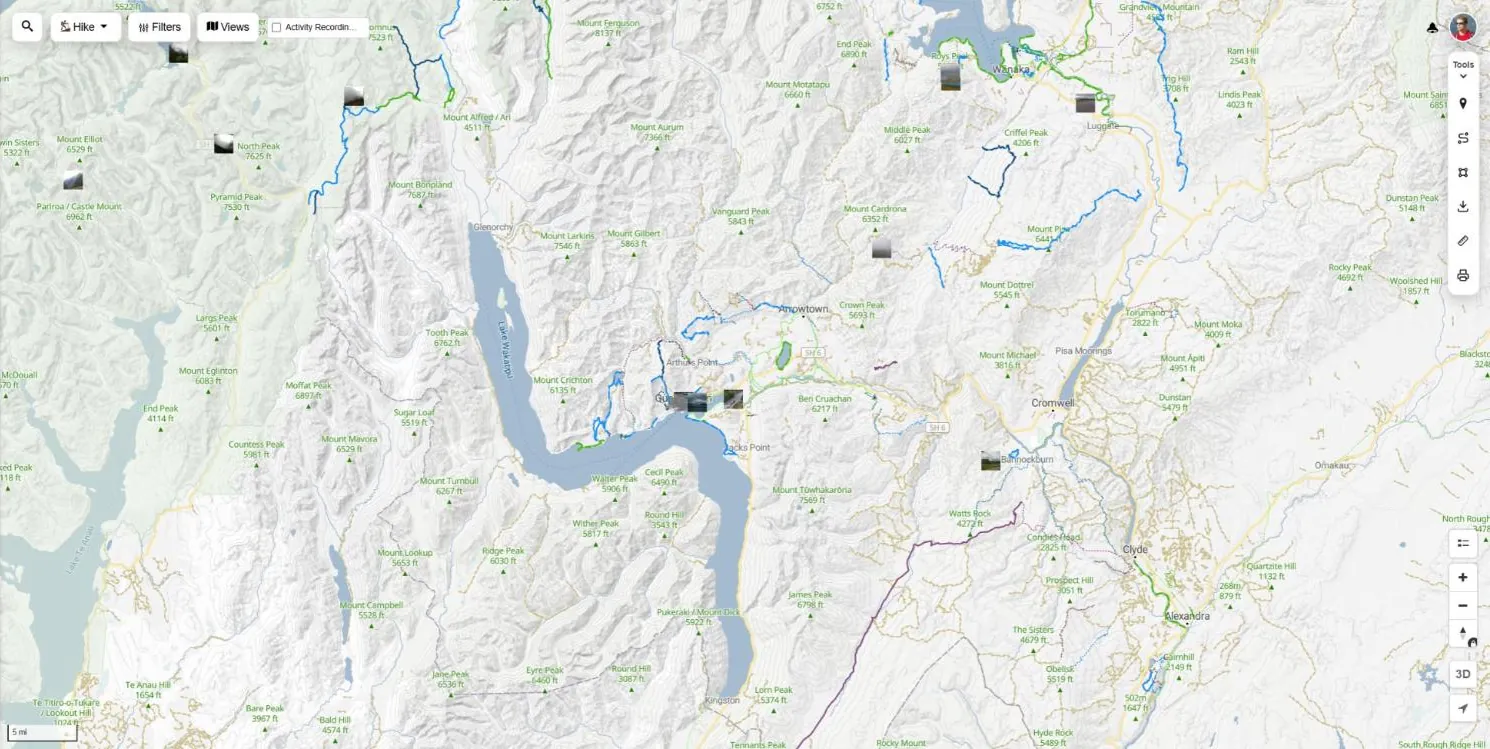
Webcams
Live webcam thumbnails on the map. See the actual conditions at the pass, the lake or the resort before you go.
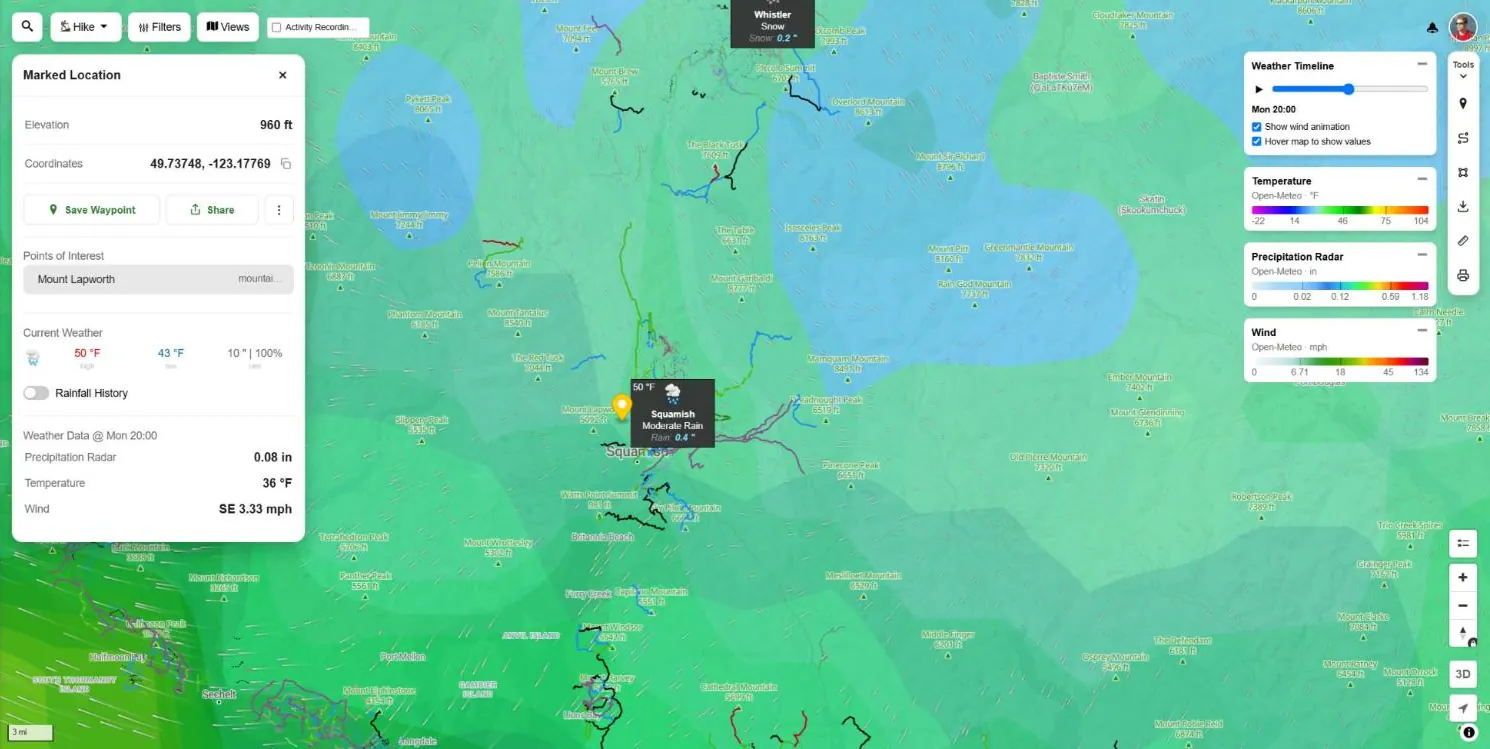
Weather at a marked location
Right-click on desktop, or long-press on a phone, anywhere on the map to drop a Marked Location. Along with the elevation and coordinates, it shows the weather for that exact spot.
- Current weather — high, low and rain from the nearest forecast city
- Rainfall history — a daily rain chart for the past weeks
- Weather data at the timeline hour — the value of every weather layer you have on, such as rain, temperature and wind direction Pro
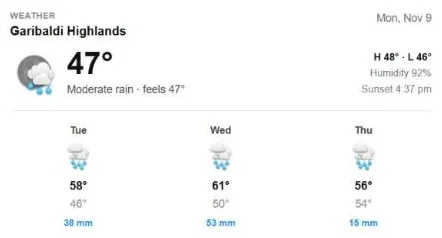
Trail & region weather forecasts
Every region, trail and route page has a weather block with the current conditions, feels-like temperature, humidity, sunset time and a 3-day forecast. No map, no setup, just the forecast for the trail you are looking at.
Region reports tab
A 3-day forecast and rain chart next to the latest trail reports, plus 5 days of rain history to judge how wet the trails are.
Weather on trail reports
Each trail report shows the local weather at the time it was posted, so a “muddy” report has context.
Weather on activity logs
Your ride or hike log records the local weather during the activity: conditions, temperature, rain, wind, clouds and humidity.
Home page forecast
Signed in, the home page shows the forecast for the town closest to you.
Region climate charts
Average high and low by day of the year and monthly rainfall on a region's Stats tab. Plan a trip for the best month.
Wet weather friendly trails
Trails tagged wet weather friendly can be filtered on the map, for the days the forecast says rain.
Snow & Rain 3D
See exactly where it will snow, where it will rain and where it will be a wet mix, painted on 3D terrain. Built for the shoulder season, when the answer depends on which side of the snow line the trail is.
- Snow, rain and snow mix bands with the freezing level
- Snow line, mix line and rain line in feet or metres
- Falling snow and rain particles, and a slowly orbiting camera
- Hourly timeline with a summit and base temperature chart
- Summit and base temperature, snowfall, wind and next 24 hour snow
- Search ski resorts and regions
Who can use what
Forecasts on trail and region pages are free. The weather map layers come with Trailforks Pro.
| Weather feature | Free account | Pro |
|---|---|---|
| Region, trail & route page forecasts | Yes | Yes |
| Weather on trail reports & activity logs | Yes | Yes |
| Region reports tab forecast & rain history | Yes | Yes |
| Avalanche forecast | Yes | Yes |
| Current wildfires & air quality | Yes | Yes |
| Marked Location current weather | Yes | Yes |
| Live radar, lightning & satellite clouds | – | Yes |
| Hourly forecast layers & weather timeline | – | Yes |
| Snow forecast, snow depth & snow stations | – | Yes |
| Smoke forecast & AQI tomorrow | – | Yes |
| Forecast city markers & webcams | – | Yes |
| Snow & Rain 3D | – | Yes |
Hiking & biking weather FAQ
What is the best weather app for hiking and biking?
A good hiking and biking weather app shows the weather where the trail is, not just in the nearest town. Trailforks puts live radar, lightning, satellite clouds, wind, temperature, snowfall, freezing level and air quality on the same map as the trails, with an hourly timeline to scrub through the next 24 hours and forecasts on every region and trail page.
Is the Trailforks weather map free?
Weather forecasts on region, trail and route pages are free, as are the avalanche forecast, current air quality and current wildfire layers. The animated forecast layers, live radar, lightning, satellite clouds, smoke, snow totals, forecast city markers, webcams and Snow & Rain 3D are part of Trailforks Pro.
How often is the live weather radar updated?
Live precipitation radar refreshes every 5 to 6 minutes for Canada, the United States and Europe, with 3 hours of playback and a short nowcast. Satellite cloud cover updates every 10 minutes with 24 hours of playback. The forecast layers update with each new model run.
Can I check the weather at a specific spot on the trail?
Yes. Right-click or long-press anywhere on the map to drop a Marked Location. It shows the current weather from the nearest forecast city and the value of every weather layer you have turned on at that exact point, such as rain, temperature and wind direction.
Does Trailforks show the weather for a past ride or hike?
Yes. Activity logs show the local weather during your ride or hike: the conditions summary, temperature, precipitation, wind, cloud cover and humidity. Trail reports also show the local weather at the time of the report.
Can I see where it will snow in the mountains?
Use the Snowfall, Snow Forecast and Freezing Level layers to see where and how much snow will fall. Snow & Rain 3D shows the snow line, mix line and rain line on 3D terrain by the hour, with summit and base temperatures for ski resorts and mountain regions.
Does the weather map work in imperial units?
Yes. Legends, hover values and the Marked Location panel follow your unit preference: °F, mph, inches and feet, or °C, m/s, millimetres and metres.
Check the weather where you ride & hike
Open the map, turn on the radar and scrub the timeline to the hour you plan to head out.
More features: Trail Mapping Tools · Route Planner · Trail Reporting · Activity Logs · All Features