more stats
2,687 ft
Distance
7 ft
Climb
-244 ft
Descent
00:02:51
Avg time
-238 ft
Altitude change
1,162 ft
Altitude min
1,400 ft
Altitude max
1,400 ft
Altitude start
1,161 ft
Altitude end
-8.8%
Grade
-68.7%
Grade max
4.7%
Grade min
210 ft
Distance climb
2,087 ft
Distance down
394 ft
Distance flat
00:02:51
Avg time

Corona-coaster Details

  • Activities
    • Mountain Bike
    • E-Bike
  • Riding Area
    Rivenrock
    Carterton
  • Difficulty Rating
  • Local Popularity
    75 in Mountain Biking [+]
    • 80 in E-Biking
  • Global Ranking
    #80273 in Mountain Biking [+]
    • #41086 in E-Biking
  • Trail Type
    Singletrack
  • Bike Type
    AM, XC
  • Direction
    Downhill Only
    Popular Direction Shown
  • Climb Difficulty
    Green
  • Physical Rating
    Moderate
  • Trail Visibility
    Always easy to follow
  • eBike Allowed
    Yes up to Class 1
  • Year Opened
    2020
  • Land Owner

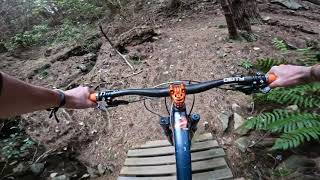
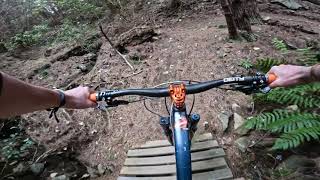
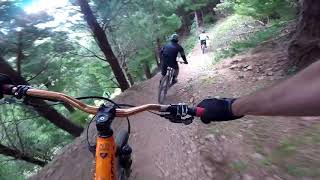
Fun, Hand dug flowy singletrack, starts off with some switchbacks then opens out into wide corners and woops. leads straight into trail connecting to pinball for extra descent time.

Access Info

peels off from blackberry lane right at the beginning of the first pine tree section

Bike Park

Local Trail Association
  • trail association logo
  • Please consider joining or donating to the local trail association to support
    trail development & maintenance.

Recent Activity on Trail

Past Week
  • 0 rides
  •  
6 Months
  • 3 rides
  • 10 miles avg distance
All
  • 138 rides
  • Last: Apr 5, 2026
c1c2c3c4
January
February
March
April
May
June
July
August
September
October
November
December
update trails status or condition

Corona-coaster Trail Reports

statusdatedescription
Oct 29, 2022 @ 4:17pm
Oct 29, 2022
Riding beautifully, super flowy! Great to have the link to Pinball back in action.
Oct 10, 2020 @ 7:12pm
Oct 10, 2020
Settling in nicely, great addition to the park
more »
Status:
on Oct 29, 2022
Ideal
Avg: 4.14 (8 votes)
Your vote: 0

view (1,046)
close
3D
Trail Conditions
  • Unknown
  • Snow Groomed
  • Snow Packed
  • Snow Covered
  • Snow Cover Partial
  • Freeze/thaw Cycle
  • Icy
  • Prevalent Mud
  • Wet
  • Variable
  • Ideal
  • Dry
  • Very Dry
Trail Flow (Ridden Direction)
Trailforks scans users ridelogs to determine the most popular direction each trail is ridden. A good flowing trail network will have most trails flowing in a single direction according to their intension.
The colour categories are based on what percentage of riders are riding a trail in its intended direction.
  • > 96%
  • > 90%
  • > 80%
  • > 70%
  • > 50%
  • < 50%
  • bi-directional trail
  • no data
Trail Last Ridden
Trailforks scans ridelogs to determine the last time a trail was ridden.
  • < 2 days
  • < 1 week
  • < 2 weeks
  • < 1 month
  • < 6 months
  • > 6 months
Trail Ridden Direction
The intended direction a trail should be ridden.
  • Downhill Only
  • Downhill Primary
  • Both Directions
  • Uphill Primary
  • Uphill Only
  • One Direction
Contribute Details
Colors indicate trail is missing specified detail.
  • Description
  • Photos
  • Description & Photos
  • Videos
Trail Popularity ?
Trailforks scans ridelogs to determine which trails are ridden the most in the last 9 months. Trails are compared with nearby trails in the same city region with a possible 25 colour shades. Think of this as a heatmap, more rides = more kinetic energy = warmer colors.
  • most popular
  • popular
  • less popular
  • not popular
ATV/ORV/OHV Filter
Max Vehicle Width
inches
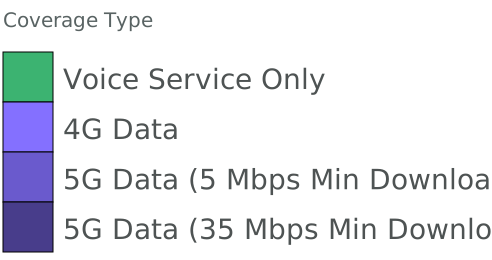
US Cell Coverage
Legend
cell carrier legend

Radar Time
Activity Recordings
Trailforks uses anonymized public activity data. ?
Activity Recordings
Trailforks uses anonymized public activity data. ?
Personal Heatmap
Activity Types
all / none
Options
2
Date range month
Winter Trails
Warning A routing network for winter maps does not exist. Selecting trails using the winter trails layer has been disabled.
Missing Trails
Most Popular
Least Popular
Trails are colored based on popularity. The more popular a trail is, the more red. Less popular trails trend towards green.
Jump Magnitude Heatmap
Heatmap of where riders jump on trails. Zoom in to see individual jumps, click circles to view jump details.
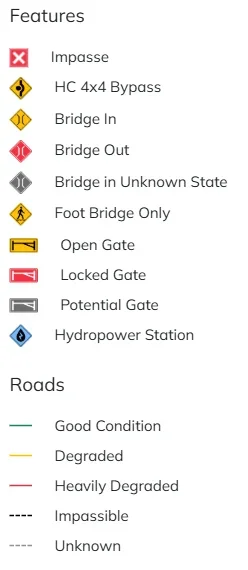
BC Backroad Status

Service Road Atlas is a free to use, community-driven service for viewing and creating reports on the numerous back-country service roads around B.C. and Alberta.

map legend
Slope Aspect
Direction the slope faces
Flat N NE E SE S SW W NW
Trails Deemphasized
Trails are shown in grey.
disable
Only show trails with no bike usage.
Enable
Suggested Layers
Based on selected activity type

    Save the current map location and zoom level as your default home location whenever this page is loaded.

    Save
        Directions to coronacoaster trailhead (-40.912060, 175.514630)

        Photos

        4 more »
        32 |
        Nov 17, 2022 @ 9:01pm
        Nov 17, 2022
        28 |
        Nov 17, 2022 @ 9:00pm
        Nov 17, 2022
        37 |
        Nov 17, 2022 @ 9:00pm
        Nov 17, 2022
        41 |
        Nov 17, 2022 @ 9:00pm
        Nov 17, 2022

        Videos

        3 more »
        youtuber Corona Coaster @ Rivenrock MTB Park
        2:52 | 258 | Jan 1, 2024 , Carterton
        youtuber Corona Coaster @ Rivenrock MTB Park
        2:52 | 254 | Nov 27, 2023 , Carterton
        Corona Coaster @Rivenrock Mountain Bike Park
        4:10 | 327 | Jul 20, 2021 , Carterton

        1 Review & Comments


        We hope you've been enjoying Trailforks!

        Create a FREE account to view trail comments and much more.

        • By VuxtaTF Pro WMBC & contributors
        • #332146 - 1,452 views

        Frequently Asked Questions About Corona-coaster

        Where is Corona-coaster located?
        Corona-coaster is located in Rivenrock, Carterton, New Zealand. It is part of the Rivenrock trail network. The trailhead is located at coordinates -40.91206, 175.51463.
        How hard is Corona-coaster?
        Corona-coaster is rated as Blue difficulty. The physical rating is Moderate. The average grade is 8.8%. The climb difficulty is rated Green.
        What is the elevation gain for Corona-coaster?
        Corona-coaster has 7 ft of elevation gain. The trail has 244 ft of elevation descent. The elevation ranges from 1,162 ft to 1,400 ft.
        Is Corona-coaster a point to point trail?
        Yes, Corona-coaster is a point to point trail. The direction is Downhill Only. The trail type is singletrack.

        Hit the Trail

        Open in App

        Get this trail on your phone instantly.
        open trail in app

        Download Trail

        Save to wishlist, Garmin & download.
        save the trail

        Find Related Routes

        Find routes and users activities that include this trail.
        find routes for this trail

        You must enter a description before submitting.